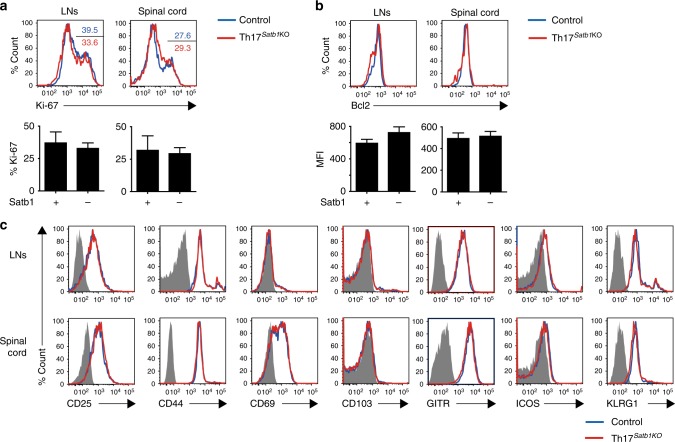
Fig. 3.
Comparable activation status between control and Satb1-deficient Th17 cells. Flow cytometry of eYFP+ CD4+ T cells from the draining LNs and the spinal cord for the expression of Ki-67 (a), Bcl-2 (b), and CD25, CD44, CD69, CD103, GITR, ICOS, and KLRG1 (c) as in Fig. 2d. The frequencies of Ki-67+ (a) and the mean fluorescence intensity (MFI) of Bcl-2+ in eYFP+ CD4+ T cells (b) are shown. The bar graphs (a and b) show the mean ± s.d. (n = 3). The results are representative of at least three independent experiments (a–c)

