Fig. 4.
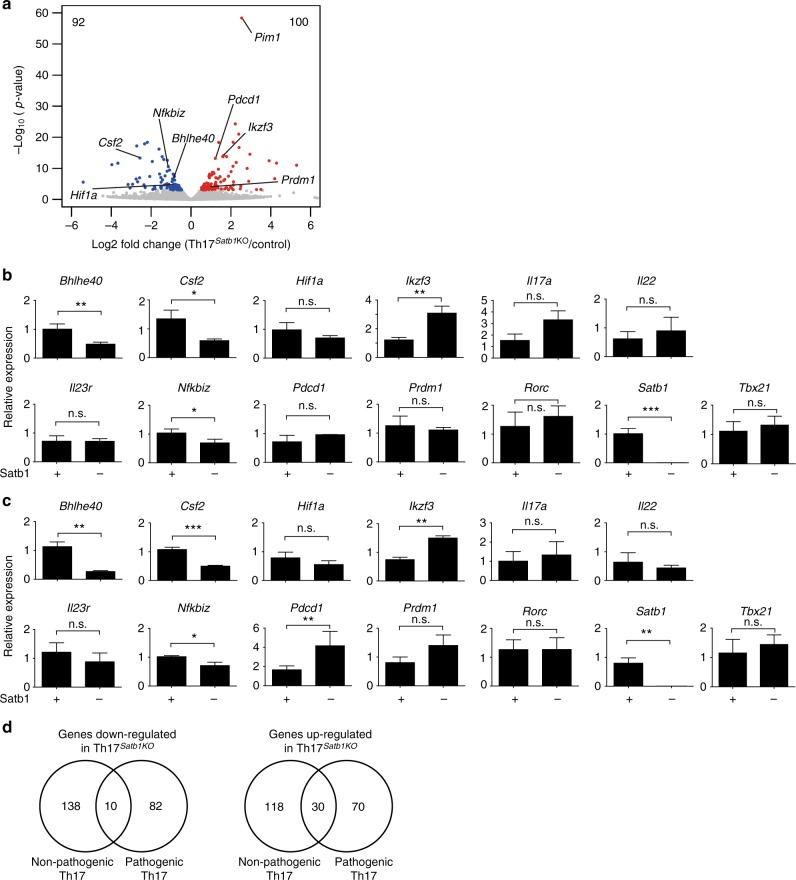
Differential gene expression in pathogenic and non-pathogenic Th17 cells from control and Th17Satb1KO mice. a RNA-seq analysis of eYFP+ CD4+ T cells from the spinal cord of control and Th17Satb1KO mice after EAE induction. eYFP+ Th17 cells were sorted at the peak of the disease (14 days after EAE induction). The volcano plot shows the differential gene expression between the Th17Satb1KO versus control eYFP+ CD4+ T cells. The genes up-regulated in Th17Satb1KO eYFP+ CD4+ T cells are shown in red, and the genes down-regulated are shown in blue. Two biological replicates were analyzed. b, c qPCR of eYFP+ CD4+ T cells from the draining LNs (b) and spinal cord (c) as in (a) for the expression of Bhlhe40, Csf2, Hif1a, Ikzf3, Il17a, Il22, Il23r, Nfkbiz, Pdcd1, Prdm1, Rorc, Satb1, and Tbx21. eYFP+ Th17 cells from the draining LNs were sorted on days 7–14 after EAE induction, and eYFP+ Th17 cells from spinal cord was sorted at the peak of the disease (14 ± 3 days after EAE induction). d Venn diagram presenting overlap of the number of down-regulated or up-regulated genes between PP eYFP+ CD4+ T cells (non-pathogenic) and eYFP+ CD4+ T cells (pathogenic) from the inflamed spinal cord of Th17Satb1KO mice after EAE induction. eYFP+ Th17 cells were sorted at the peak of the disease (14 days after EAE induction). The bar graphs (b and c) show the mean ± s.d. (n = 3). *P < 0.05, **P < 0.001, ***P < 0.0001 (two-tailed unpaired Student’s t-test)

