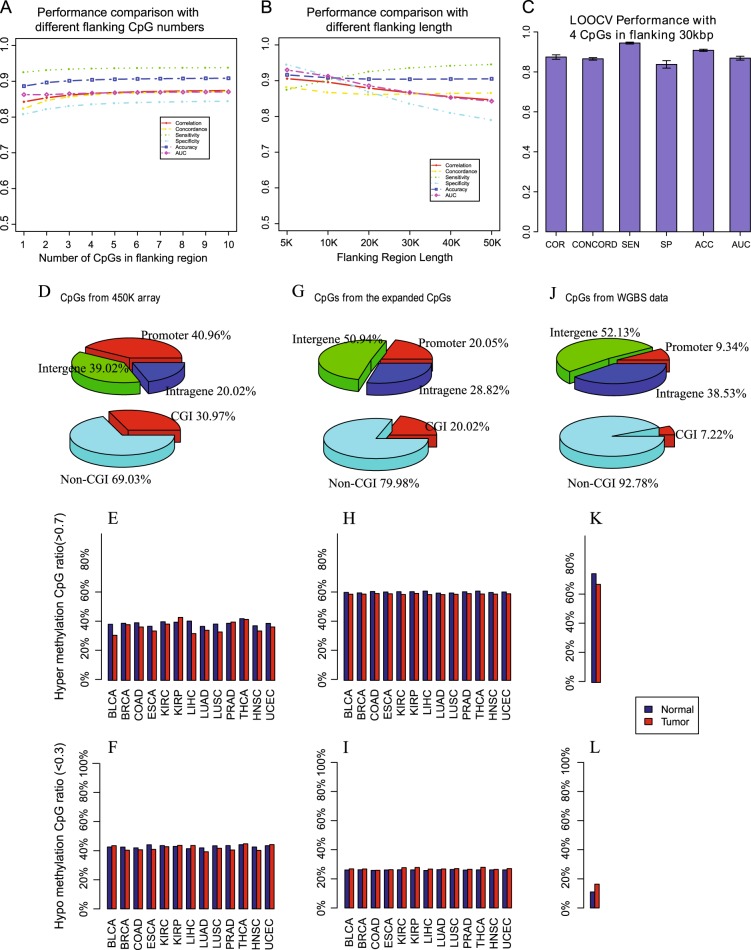
Fig. 2.
The performance of EAGLING model and the expanded methylation profile. a and b The leave-one-tissue-out cross validations with different flanking CpG numbers and sizes of the flanking regions. c The performance with four CpGs in the flanking 30 Kbp regions. Pearson correlation coefficient (COR), concord (CONCORD, the percent of CpGs with a methylation proportion difference less than 0.2560), sensitivity (SE), specificity (SP), accuracy (ACC), and Area Under ROC Curve (AUC) are used as the metrics to assess the performance. d, e, and f are the CpG location, hyper/hypo methylation ratio in tumor/normal samples from the Illumina 450 K array, respectively.g, h, and i are the CpG location, hyper/hypo methylation ratio from the expanded data, respectively. j, k, and l are the CpG location, hyper/hypo methylation ratio from the WGBS data, respectively

