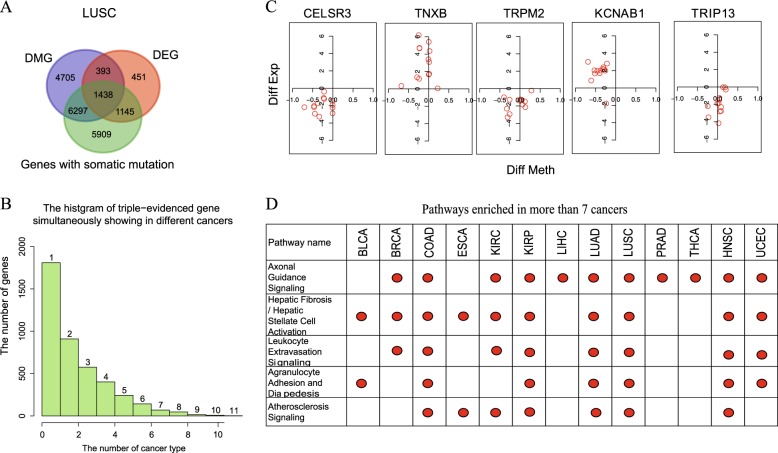
Fig. 3.
Analysis of triple-evidenced genes and enriched pathways. a Genes supported by one, two or three evidences in LUSC. b The number of triple-evidenced genes shared between the 13 cancers. c The differential methylation and expression levels of the top five triple-evidenced genes (difference = normal value − tumor value) that are most common in the 13 cancers. X axis is the difference of methylation, y axis is the log2(RPKM ratio) to represent the gene expression difference. One red circle in each graph represents a cancer type. d The top five pathways enriched in the 13 cancers, the red dot indicates the cancer type in which a pathway is enriched

