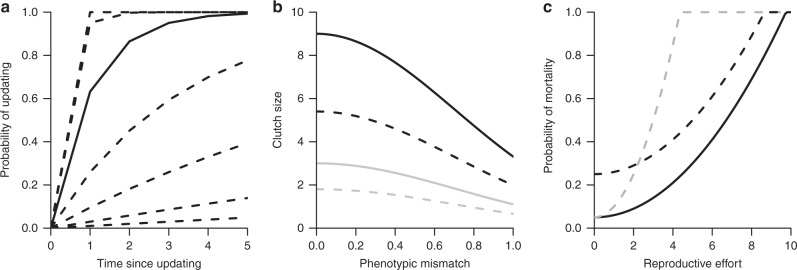
Fig. 1.
Model assumptions. a Probability of updating increases with time since last updating, but the rate of increase is regulated by u. Solid line is for u = 1, dashed lines above are for larger values of u = {3,10} and dashed lines below are for lower values of u = {0.3, 0.1, 0.03, 0.01}. b Clutch size, c, decreases with phenotypic mismatch, m, with the environment. Black lines are for high reproductive effort r = 9, grey indicates lower reproductive effort r = 3. Solid lines indicate clutch size when the individual did not update their phenotype, while dashed lines indicate the lower clutch size when individuals update due to costs of updating, κ = 0.4. c Mortality probability increases with reproductive effort, r. Solid line shows the probability of mortality when the individual has no phenotypic mismatch and ρ = 0.01, the black dashed line shows the mortality for individuals that mismatch their environment by 0.2 and the grey dashed line indicates mortality for when cost of reproduction, ρ, is increased to 0.05 (see Supplementary Note 2)

