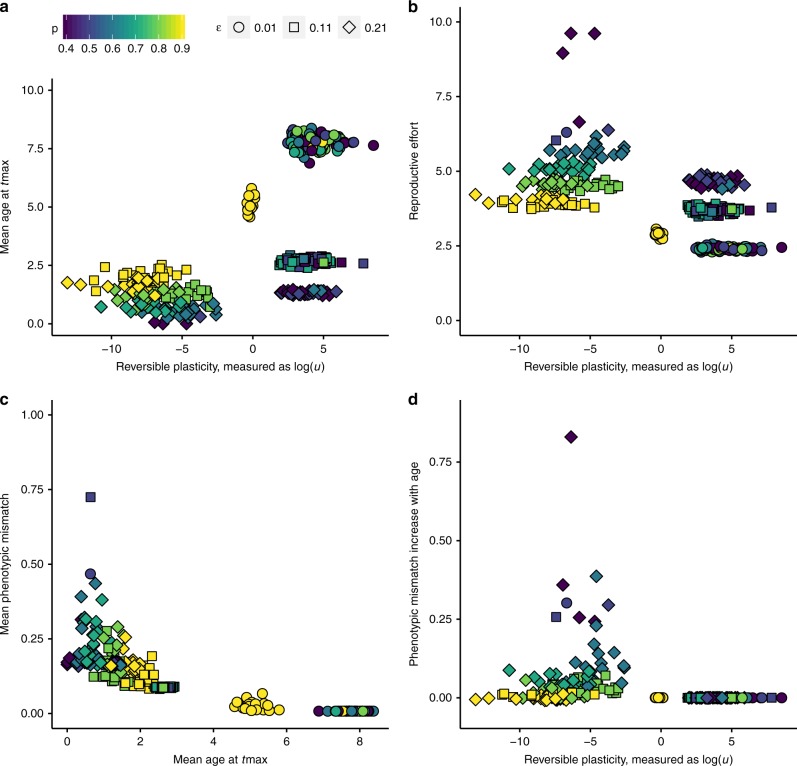
Fig. 2.
Relationships between populations mean trait values at the end of all simulations. a Mean age of individuals—a measure of lifespan—measured at the end of the simulation (tmax); long lifespan is only found at high plasticity levels. b Mean evolved reproductive effort (gene value) covaries negatively with plasticity, measured as updating effort, u. c Mean population-wide mismatch against mean age of individuals measured at tmax. d The regression slope between individual mismatch and individual age, measured at tmax, with positive values indicating that older individuals are more mismatched to the current environment. Frequent enough plasticity can prevent this type of senescence. Symbol shapes indicate sampling error (ɛ); colour (from dark blue to yellow) indicates increasing environmental autocorrelation (p)

