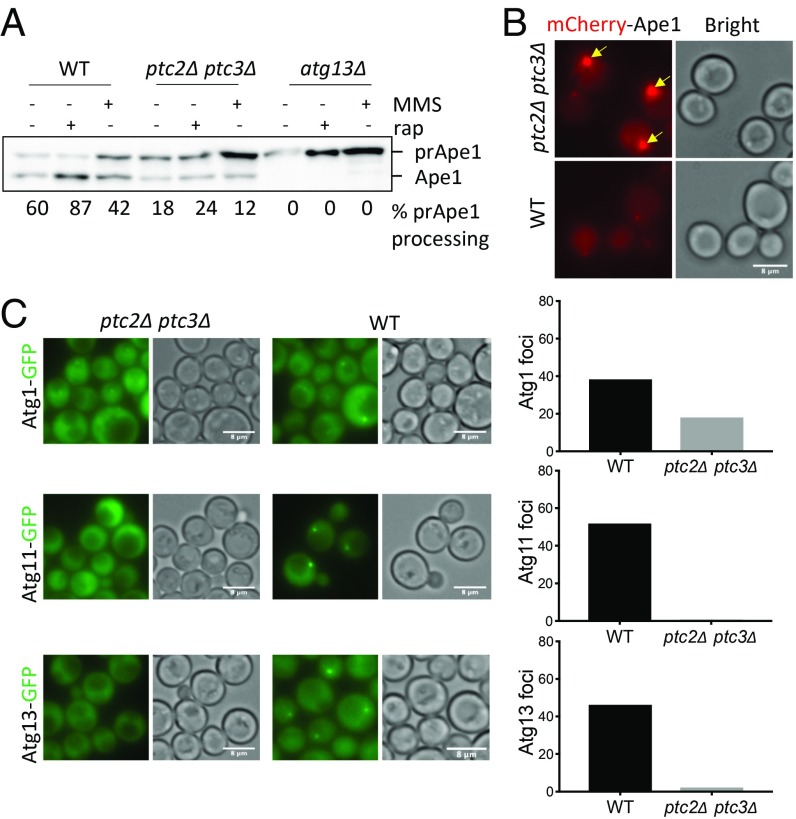
Fig. 2.
Ptc2 and Ptc3 phosphatases promote the Cvt pathway. (A) Precursor Ape1 processing in WT, ptc2Δ ptc3Δ, and atg13Δ mutants after 4-h rapamycin or MMS treatment. The ratio of mature Ape1 to total Ape1 signal for each lane is presented below every lane. (B) mCherry-Ape1 localization in WT and ptc2Δ ptc3Δ cells 4 h after rapamycin treatment. Yellow arrows mark the large perivacuolar prApe1 puncta that correspond to the PAS. (C) Localization of Atg1-GFP, Atg11-GFP, and Atg13-GFP in ptc2Δ ptc3Δ and WT cells grown in rich media. Percentages of cells with visible Atg1, Atg11, or Atg13 foci were quantified and plotted. More than 150 cells were counted for each condition. (Scale bar: B and C, 8 μm.)

