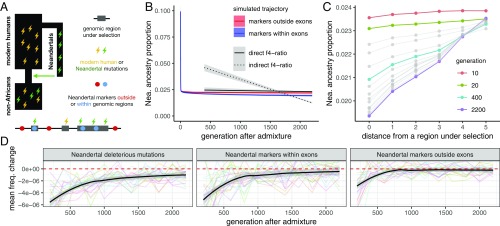
Fig. 3.
Simulations of selection against Neandertal ancestry. (A) Deleterious mutations (lightning bolts) accumulate in realistically distributed exonic sequence in modern humans and Neandertals. These regions accumulate additive, deleterious mutations, using a mutation rate of 10−8 per base pair per generation. To track the dynamics of Neandertal ancestry over time, neutral Neandertal markers are placed within (blue dots) and between (red dots) exons on all Neandertal chromosomes before introgression. (B) Simulated Neandertal ancestry proportions across 55 ky, in exonic and nonexonic sequence, averaged over 20 simulation replicates. Empirical observations from Fig. 1A are shown for comparison. Initial introgression levels were simulated at 10%. (C) Depletion of simulated Neandertal ancestry at neutral markers over time as a function of distance to regions under selection. Markers in bin 0 are those falling within exons; bins 1–5 represent quintiles of distance to the nearest exon. (D) Changes in frequencies of neutral Neandertal markers and deleterious Neandertal mutations over time, starting from generation 200. Each line shows average allele frequency changes over one simulation replicate. Black lines show smooth fits of these averages over 20 replicates.

