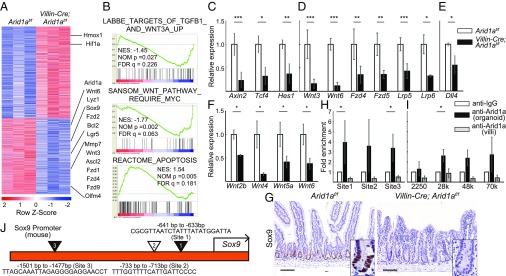
Fig. 4.
Intestinal Arid1a deletion results in down-regulation of Wnt signaling and Sox9. (A) Heatmap of differentially up- and down-regulated genes from RNA-seq using crypt RNA at 8 wk of age (n = 3, red is higher, blue is lower expression). (B) GSEA shows that Wnt signaling pathway is suppressed and apoptosis pathway is up-regulated in Villin-Cre;Arid1af/f mouse intestines. The LABBE_TARGETS_OF_TGFB1_AND_WNT3A_UP gene set contains up-regulated genes in NMuMG cells (mammary epithelium) after stimulation with both TGFB1 and WNT3A. The SANSOM_WNT_PATHWAY_REQUIRE_MYC gene set contains Wnt target genes up-regulated after Cre-lox knockout of APC in the small intestine that require functional MYC. The REACTOME_APOPTOSIS gene set contains genes involved in apoptosis. Nominal enrichment score (NES), nominal P value, and FDR q-value are shown in each GSEA plot. (C–E) Relative expression levels of Wnt target genes(C), Wnt agonist and receptor genes (D), and Dll4 (E) in control and Villin-Cre; Arid1af/f mice by q-PCR using crypt RNA at 8 wk of age (n = 5). (F) Relative expression levels of Wnt agonist genes in control and Villin-Cre;Arid1af/f mice by q-PCR using whole tissue RNA at 8 wk of age (n = 3). (G) Sox9 staining of Arid1af/f (Left) and Villin-Cre; Arid1af/f mice (Right) at 8–10 wk of age. (Scale bars, 100 µm.) (Inset magnification, 2.7×.) (H) Arid1a binding to the Sox9 promoter regions by ChIP assay using intestinal spheroid cells (n = 5) and isolated villous cells (n = 3) from wild-type mice at 8 wk of age, respectively. IgG antibody was used as negative control. (I) Arid1a binding to the Sox9 enhancer regions by ChIP assay using intestinal spheroid cells and isolated villous cells from wild-type mice at 8 wk of age (n = 3), respectively. IgG antibody was used as a negative control. (J) Diagram of the murine Sox9 promoter sites where Arid1a binds directly (triangles) as investigated by ChIP assay. The black arrow indicates the transcription start site. The black triangles indicate the DNA binding sites (site 1 and site 3) as confirmed by ChIP assay. The white triangle indicates the additional DNA binding site (site 2). Quantitative data are presented as means ± SD, *P < 0.05, **P < 0.01, ***P < 0.001.

