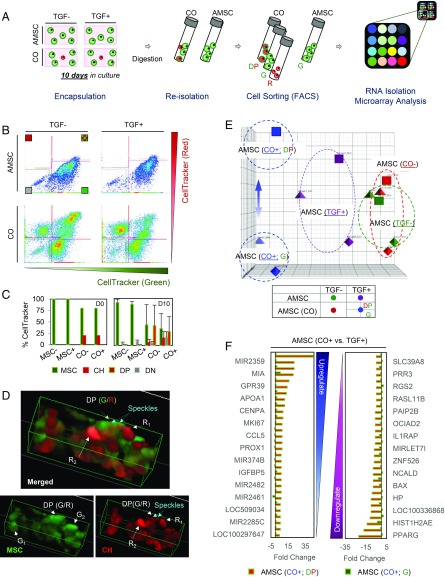
Fig. 4.
Molecular profiling of coculture induced pathways in AMSCs. (A) AMSC (green) alone or AMSC/JCH (green/red) cocultured populations were seeded in 1% MeHA hydrogels at 20 million cells (AMSC:JCH, 4:1) and cultured in the presence or absence of TGF-β3. After 10 d, cells were reisolated and sorted using FACS. Sorted AMSCs (green or DP) were used for RNA isolation, followed by microarray and pathway analyses. (B and C) FACS results (B) showed DP cells present in the CO groups, regardless of TGF-β3. Nearly one-half of the AMSCs in the coculture became DP (CO_DP) over 10 d (C). (D) Three-dimensional reconstructions from confocal microscopy identified red speckles in AMSCs (green). (E) PCA analysis. (F) List detailing the 30 genes showing the greatest fold change with coculture (positive, Left; negative, Right). AMSCs mixed with JCHs (CO+_DP or CO+_G) were compared with AMSCs cultured alone (TGF+_G) CO+_DP/TGF+ (CO+_G/TGF+).

