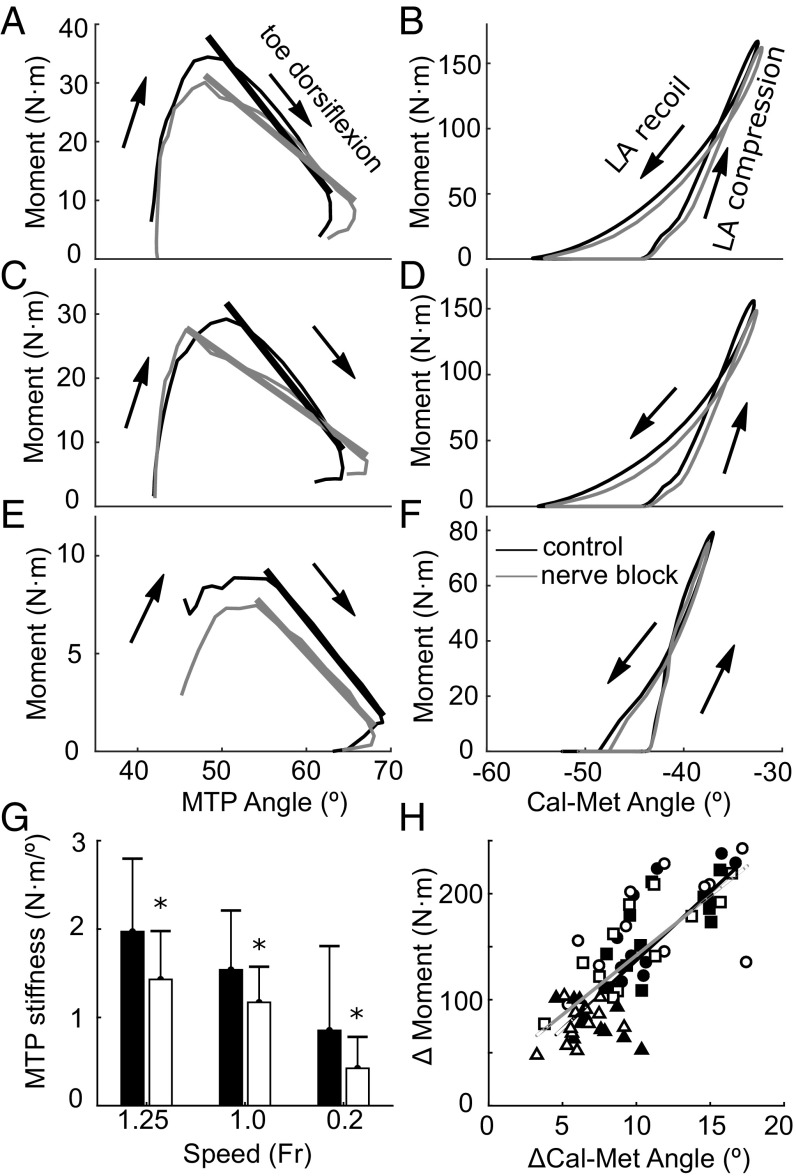
Fig. 3.
The-stiffness of the MTP joint during late stance was greater in the control condition than in the nerve block condition, but there was no change in stiffness of the long arch. A, C, and E plot the MTP angle against the MTP moment for running (A: Fr = 1.25; C: Fr = 1.0) and walking (E, Fr = 0.2), and each has a linear fit to illustrate the stiffness of the joint late in stance (black, control; gray, nerve block). G shows a bar graph of the mean (±SD) stiffness values (slope) from the linear fits in A, C, and E for each speed and highlighting a significant effect of the nerve block (N = 12; P < 0.05) with asterisks. B, D, and F plot the Cal-Met angle vs. the midfoot moment to approximate the stiffness of the long arch (control, black; nerve block, gray). There was no effect of the nerve block on long arch stiffness during loading. Across all speeds, the peak deformation of the long arch (ΔCal-Met angle) increased with increasing midfoot moment (H), but linear fits to the data show that this relationship was unaffected by the nerve block (gray/open symbols, nerve block; black/filled symbols, control; triangles, walking; squares, slow running; circles, faster running).

