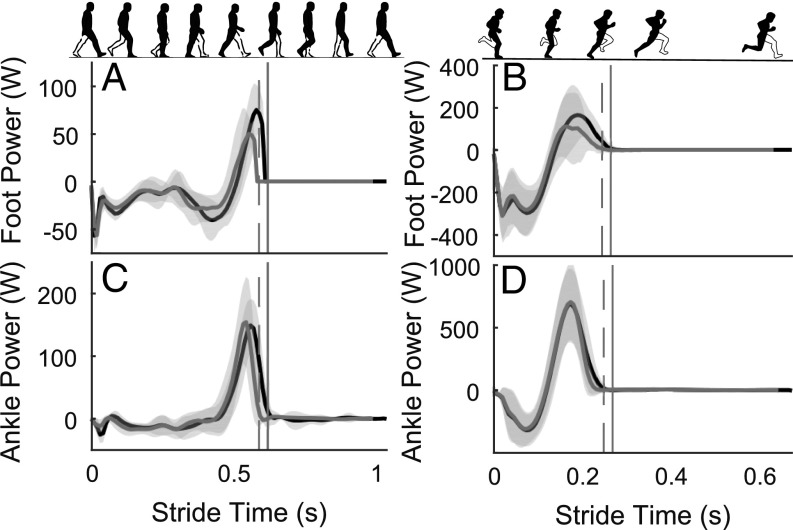
Fig. 4.
Positive power produced by the foot and ankle in late stance was reduced by the nerve block. Group mean (±SD) time series power data for the foot (A and B) and ankle joint (C and D). The left column is data from walking (Fr = 0.2) and is scaled differently to the right column, which is faster running (Fr = 1.25). Across all speeds, the distal foot produced less positive power in late stance in the nerve block condition (gray lines) compared with the control condition (black lines). Ankle positive power in late stance dropped earlier across all speeds for the nerve block condition, and this was linked with reduced stance and stride times when the nerve block was applied. Data are plotted from foot–ground contact to ipsilateral foot–ground contact, and the vertical lines represent the end of the stance phase for control (solid) and nerve block (dashed) conditions, respectively. Power data for all leg joints, in all conditions are provided in SI Appendix (SI Appendix, Fig. S1).

