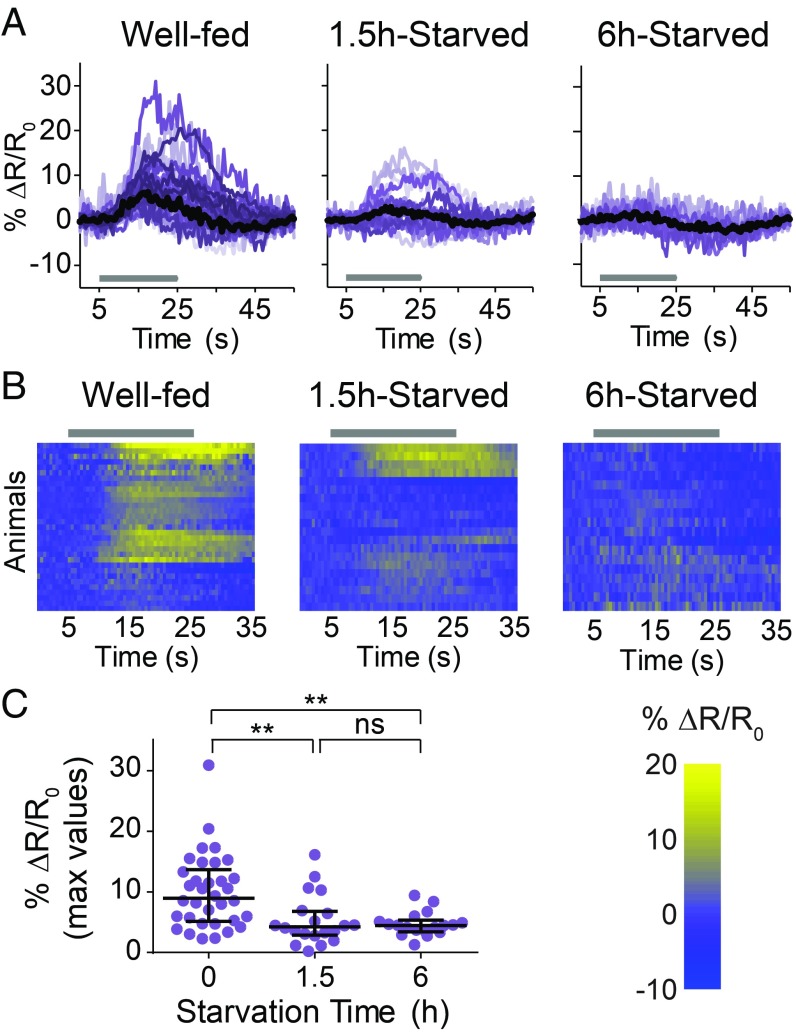
Fig. 2.
Starvation suppresses the CO2-evoked activity of RIG. (A) Colored lines depict individual traces, and black lines depict medians. (B) Each row represents the response of an individual animal. Responses are ordered by hierarchical cluster analysis. (A and B) Gray bars indicate the timing of the CO2 pulse. (C) The dot plot shows maximum values of % ΔR/R0 for each animal; lines show medians and interquartile ranges. n = 17–18 animals per condition. **P < 0.01, Kruskal–Wallis test with Dunn’s posttest. Responses are to 10% CO2.

