Fig. 1.
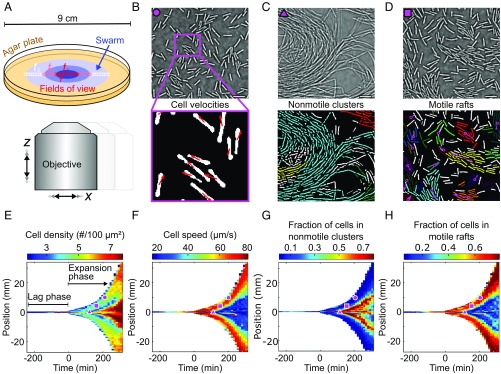
Adaptive microscopy reveals complete multiscale dynamics of bacterial swarm expansion. (A) Movies at single-cell resolution are acquired at different locations in the swarm, starting from 1 cell to 100 cells, and follow swarm expansion until the agar plate is completely colonized. The number of movies and locations where movies are acquired (indicated by colored squares) are determined adaptively, depending on the detected swarm size. B–D, Top show qualitatively different bacterial behavioral dynamics observed at distinct space-time points, which are marked in E–H by corresponding magenta symbols. B–D, Bottom demonstrate automated extraction of single-cell positions, orientations, and cell velocities (B) as well as collective behaviors, such as formation of nonmotile clusters (C) and motile rafts (D), corresponding to groups of aligned cells that move in the same direction. Cells assigned to the same nonmotile cluster or motile raft by the classification algorithms share the same color; cells labeled in white have not been identified as belonging to any motile raft or nonmotile cluster. Magenta arrows in D indicate the average velocity of a raft. (Scale bars, 10 .) (E) Heatmap of the cell density, obtained by averaging single-cell data as in B–D for each movie at each space-time coordinate. The lag phase, a period following inoculation during which the swarm does not expand, as well as the expansion phase, is indicated. (F–H) Additional heatmaps for the cell speed, fraction of cells that are in nonmotile clusters in a given field of view, and fraction of cells that are in motile rafts. A total of 23 statistical observables analogous to E–H were determined at each space-time position (Materials and Methods and SI Appendix, Table S4).

