Fig. 2.
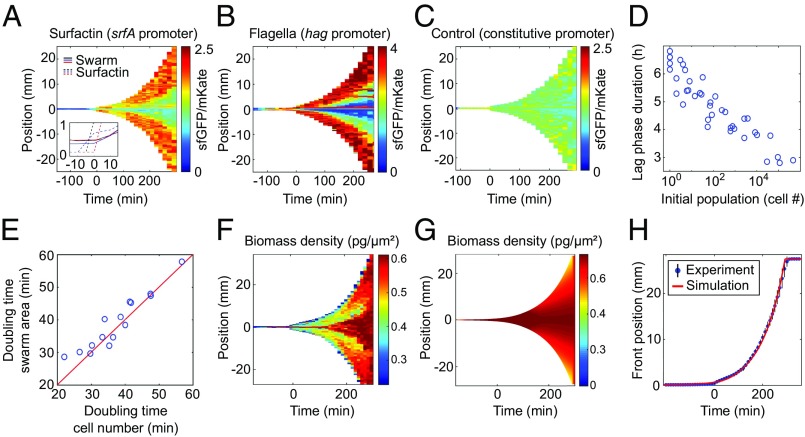
Spatiotemporal gene-expression and macroscopic swarm expansion dynamics. (A) Heatmap of the srfA promoter fused to a green fluorescent protein (sfGFP), reporting transcriptional activity of surfactin production, normalized by constitutively expressed mKate2 fluorescence, in units of sfGFP levels per mKate2 levels. (A, Inset) A surfactin front becomes visible in phase-contrast microscopy just before the swarm expansion begins. (B) Fluorescence signal for the hag-promoter reporter, indicating that flagella production also increases (SI Appendix, Fig. S10) before expansion. (C) Control experiment in which sfGFP and mKate2 levels are driven by the same constitutively expressed promoter, showing no space-time variation in signal. (D) Lag-phase duration depends logarithmically on the initial seeding population size. (E) The average cellular doubling time per experiment correlates with the swarm area doubling time; the red line corresponds to exact equality of both time scales. (F–H) The experimentally determined biomass density (F) agrees with the predictions of the continuum model (G and H), indicating that growth pressure drives the exponential front expansion. The experiments in A–C and F displayed lag times of 5–5.5 h, yet the reporter results are shown only for times larger than −120 min, because at earlier times the fluorescent signals were too low to determine a reliable ratio of GFP/mKate levels.

