Fig. 2.
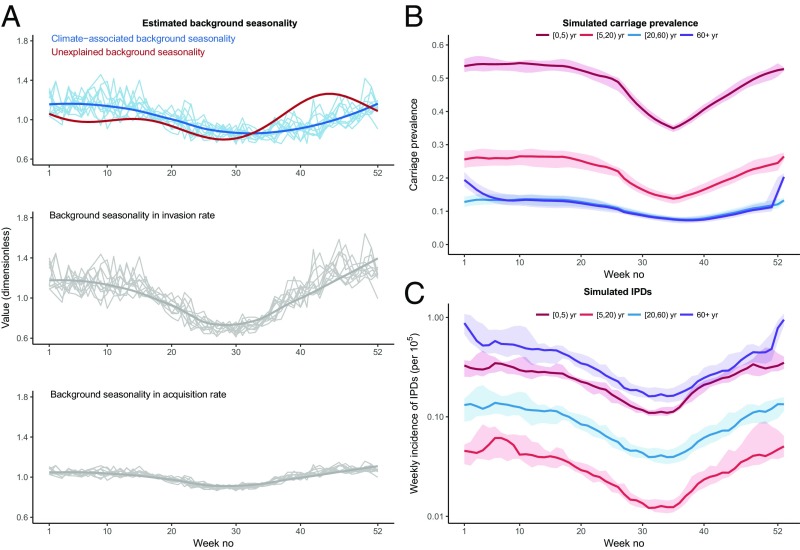
Dissecting pneumococcal seasonality. (A) (Top) The shape of the estimated background seasonality, which comprised an unexplained seasonality (modeled using a Fourier series with two harmonics, red line) and a climate-associated seasonality (blue lines). For the climate-related seasonality, each light blue line represents a distinct epidemiological year; the dark blue line is the average seasonal shape. (Middle) The estimated seasonality in the invasion rate (that is, the rate at which pneumococcal carriers contract an IPD), which was the product of the unexplained seasonality and the climate-associated seasonality. (Bottom) The estimated seasonality in the carriage acquisition rate, which had a similar seasonal shape but damped oscillations. In the Middle and Bottom, each light gray line represents a distinct epidemiological year; the dark gray line is the average seasonal shape. (B) Median (range) simulated carriage prevalence in different age groups. (C) Median (range) simulated IPD incidence (per 100,000 population) in different age groups. All of the estimates and simulations presented in this figure are from the best model.

