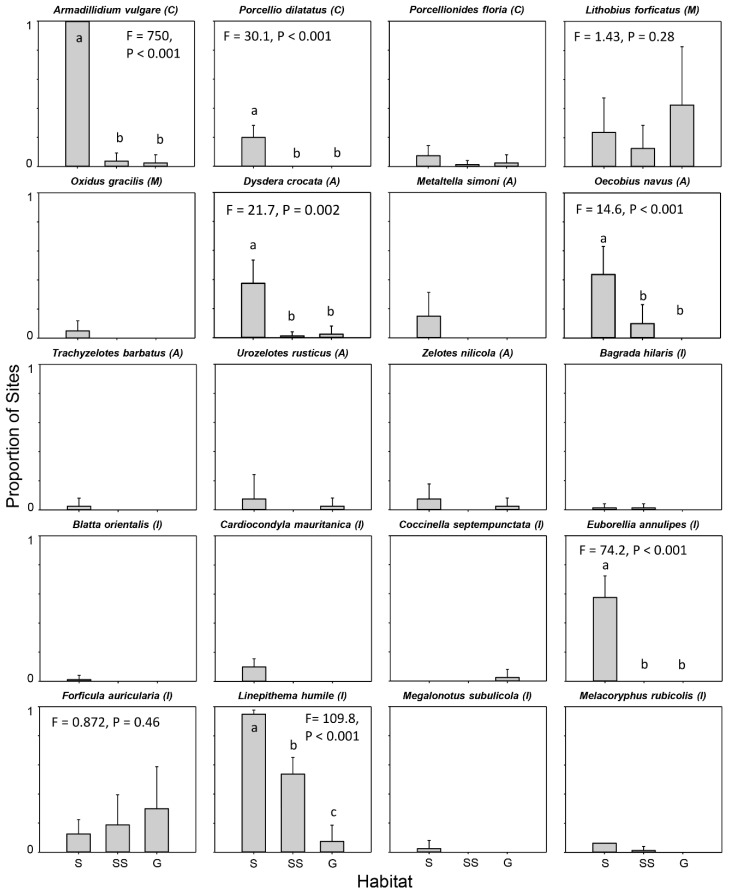
Figure 1.
Site occupancy for each non-native species. Bar height is the mean proportion of sites occupied in each habitat type (S = Suburban; SS = Sage scrub; G = Grassland) over the five sampling periods. Error bars show standard deviation. Pseudo-F statistics and P-values from PERMANOVA tests are reported for those species that were collected in at least 18 sites over the 5 sampling periods. Letters on or above bars indicate significantly different means based on pair-wise comparisons. Letters next to species names indicate subphylum or class: C = Crustacea; M = Myriapoda; A = Arachnida; I = Insecta.

