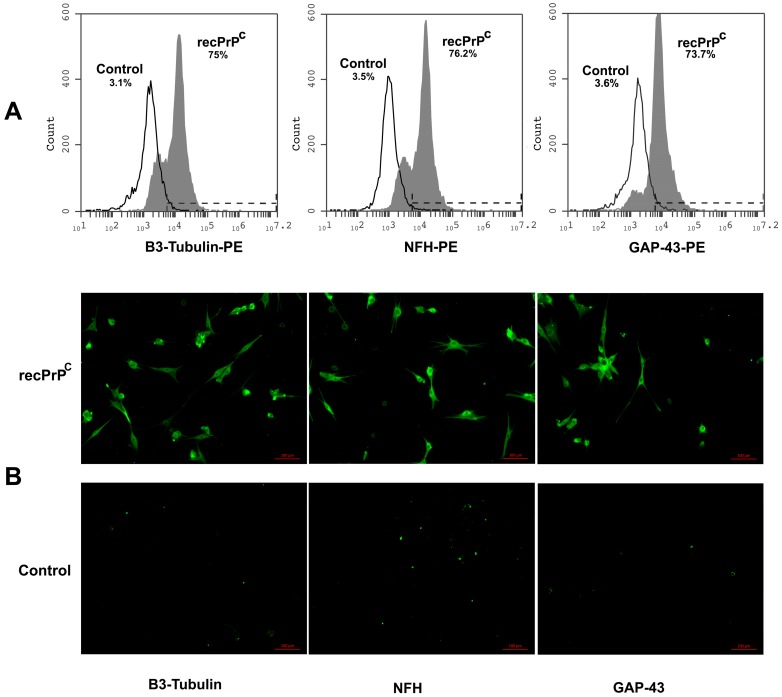
Figure 4.
Effect of recPrPC on expression of neuronal markers GAP-43, NFH and B3-Tubulin. hDPSCs, untreated or treated with recPrPC for 14 days, were analyzed by flow cytometry and immunofluorescence analysis using anti-NFH, Anti-B3-Tubulin and anti-GAP-43. (A) Flow Cytometry. Histograms represent log fluorescence vs. cell number, gated on cell population of a side scatter/forward scatter (SS/FS) histogram. Cell number is indicated on the y-axis and fluorescence intensity is represented on the x-axis. Each panel was compared with the corresponding secondary antibody as negative control. A representative experiment among 3 is shown. (B) Immunofluorescence analysis. Alternatively, hDPSCs were analyzed by immunofluorescence analysis using anti-B3-Tubulin, anti-NFH and anti-GAP-43 and observed with a Zeiss Axio Vert. A1 fluorescence microscope (Zeiss, Oberkochen, Germany). Scale bars, 100 µm.

