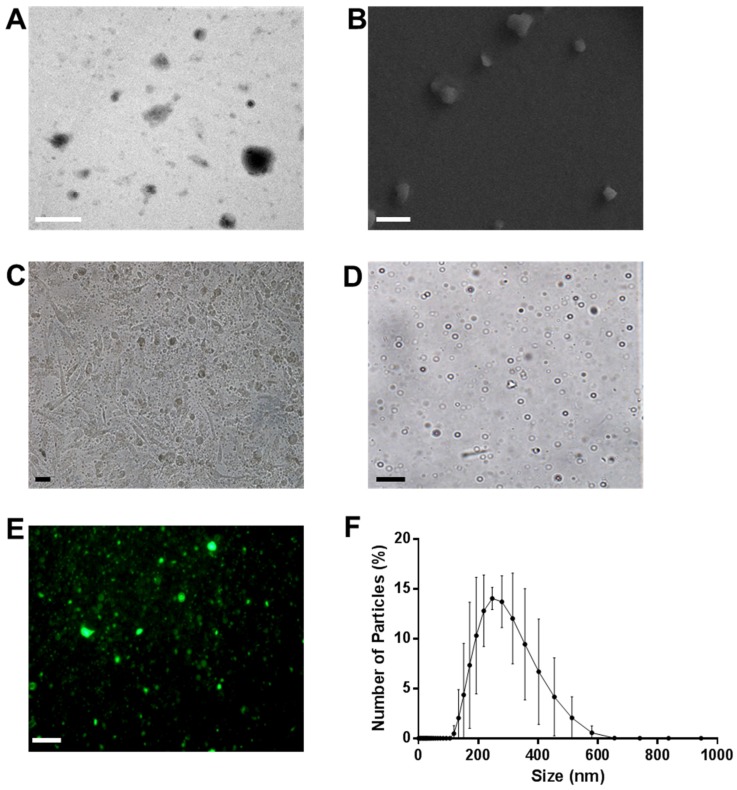
Figure 2.
Characterization of oxygen nanobubbles (ONBs) with a lipid ratio of 85:8:7. (A) Transmission electron microscopy (TEM) image, with a scale bar of 500 nm. (B) Scanning electron microscopy (SEM) image, with a scale bar of 1 µm. (C) MDA-MB-231 cells with 10% ONBs in the media and a scale bar of 10 µm. (D) Micro-sized bubbles with a scale bar of 10 µm. (E) Fluorescent bubbles with a scale bar of 10 µm. (F) Combined DLS data of ONBs with n = 6.

