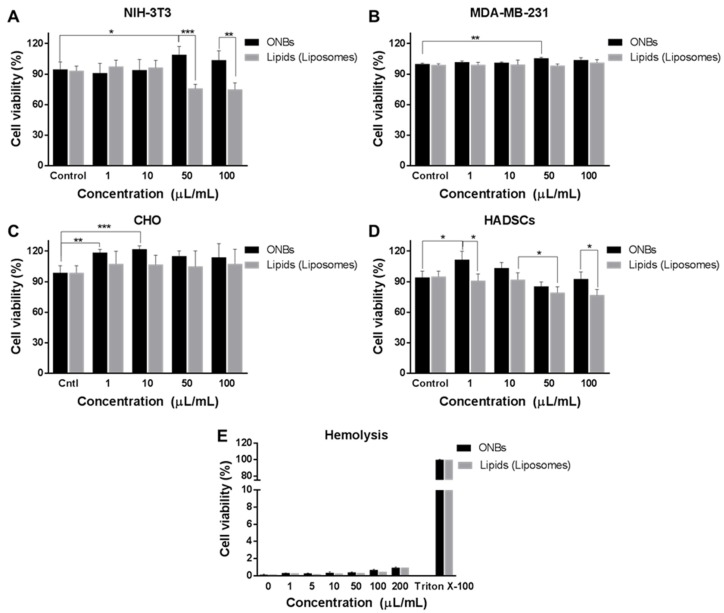
Figure 3.
Cell viability test for ONBs determined through CCK-8. Cell viability of various concentrations of ONBs and lipids in NIH-3T3 (A) in MDA-MB-231 (B), in CHO (C) and in HADSCs (D) cell lines. (E) Hemolysis experiment for ONBs and lipids. Here, *, **, and *** highlight p-values of less than 0.05, 0.01, and 0.001, respectively.

