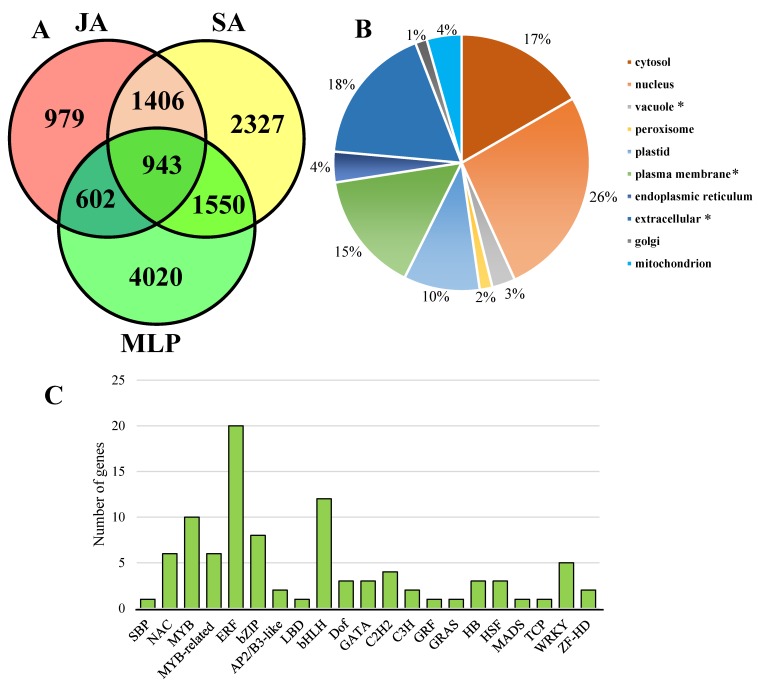
Figure 1.
Venn diagram represented the number of specific and overlapping genes identified as jasmonic acid (JA)-responsive, salicylic acid (SA)-responsive, and Melampsora larici-populina (MLP)-responsive genes (A). The proportion of cellular locations of proteins encoded by common responsive genes (CRG, (B)). The star behind the cellular location indicates that the p-value of the hypergeometric distribution test was less than 0.05. The gene numbers in each transcription factor family were showed in CRG(C).

