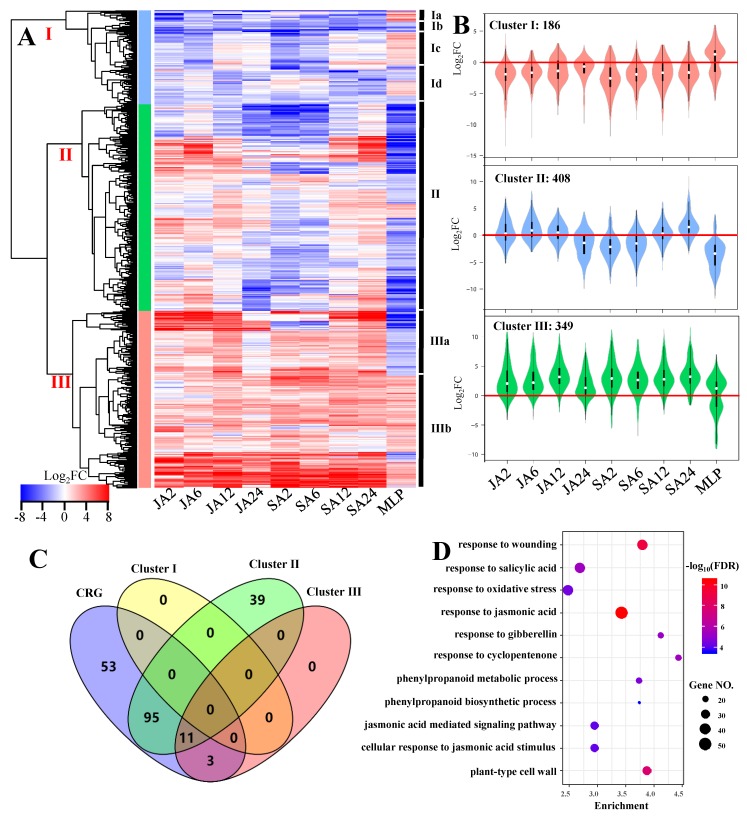
Figure 3.
Heatmap clustered the CRG into three clusters based on their gene expression profiles (A). The average expression levels of genes from different clusters under different treatments (B). Venn diagram presents the overlapping GO term detected from CRG, Cluster I, Cluster II, and Cluster III (C). The significantly enriched GO terms commonly detected in CRG, Cluster II, and Cluster III (D). FDR, false discovery rate; FC, folds change.

