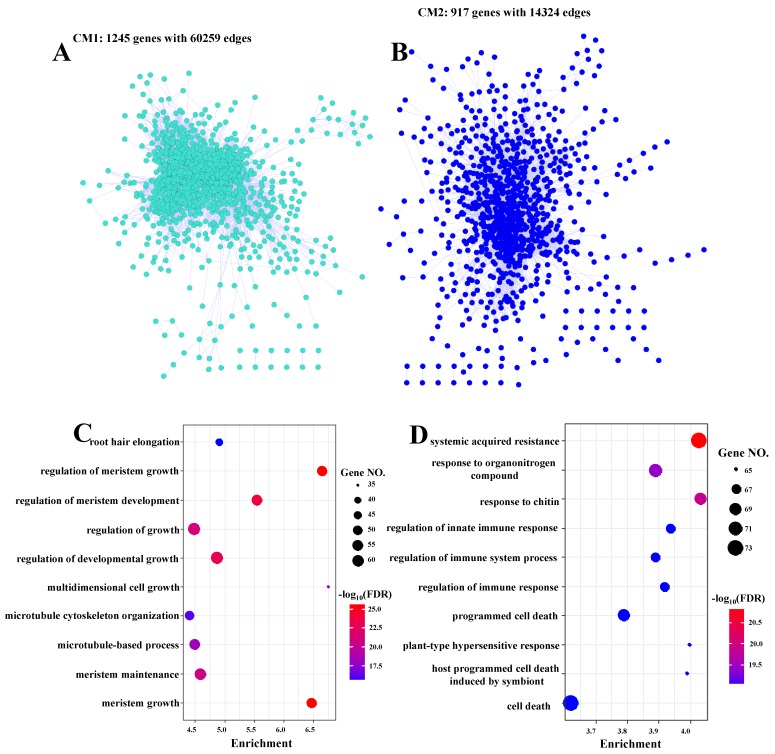
Figure 6.
Gene co-expression networks of co-expression module 1 (CM1, (A)) and co-expression module 2 (CM2, (B)). The nodes and edges represented the genes and the significant correlations between genes, respectively. The top 10 significantly enriched GO terms in biological process in CM1 (C) and CM2 (D).

