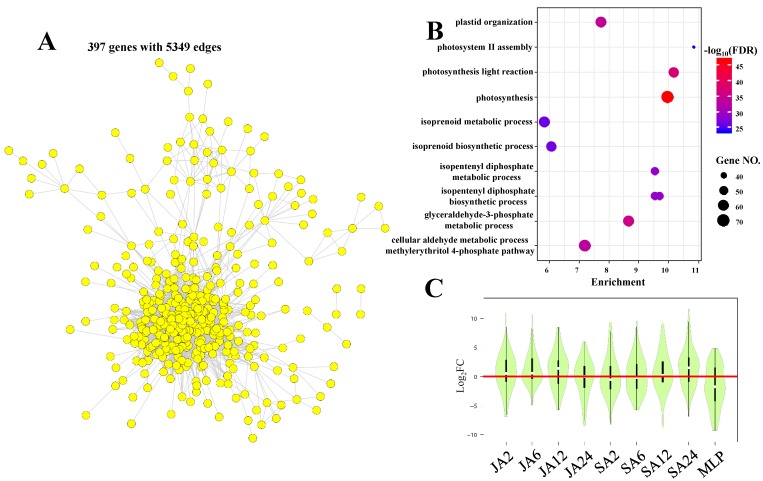
Figure 8.
Gene co-expression networks of co-expression module four (A). The nodes and edges represented the genes and the significant correlations between genes, respectively. Genes without any edges were not presented in the network. The top 10 significantly enriched GO terms in biological processes in CM4 (B). The average expression levels of CRG from CM4 upon different treatments (C).

