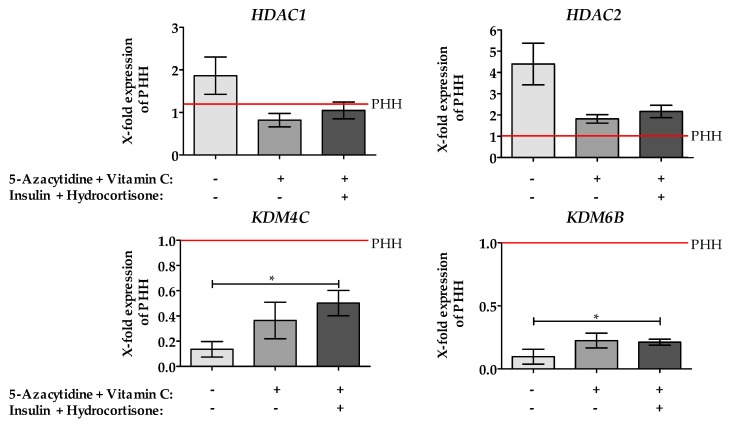
Figure 3.
Effect of epigenetic modifying compounds on the expression of Chromatin Modifying enzymes. The expression levels of different chromatin modifying enzymes were measured by qRT-PCR. Unstimulated HepG2 cells (grey bars), as well as HepG2 cells after 48 h stimulation with 10 µM 5-AZA plus 0.5 mM Vitamin C with (dark bars)/without (black bars) Insulin and hydrocortisone, were used. As a control, freshly isolated hepatocytes were used, (red line). Values were normalized to GAPDH and represent the mean of N = 3, n = 3. For the positive control a pooled sample of five different primary human hepatocyte (PHH) donors was used. Bars represent mean ± SEM * p ≤ 0.05 as indicated.

