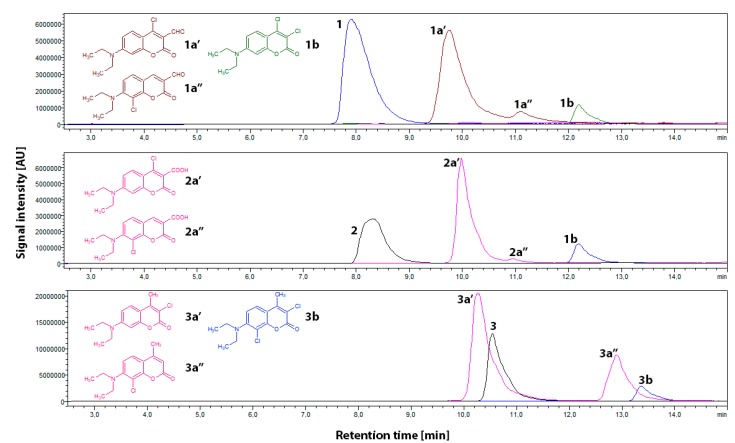
Figure 4.
HPLC-MS traces and proposed structures of chlorination products of 150 μM probes 1–3 by 150 μM of NaOCl at pH 3 and a temperature of 25 °C. Peak numbering is presented in Table 1. (The remaining HPLC-MS data are given in the supplementary information).

