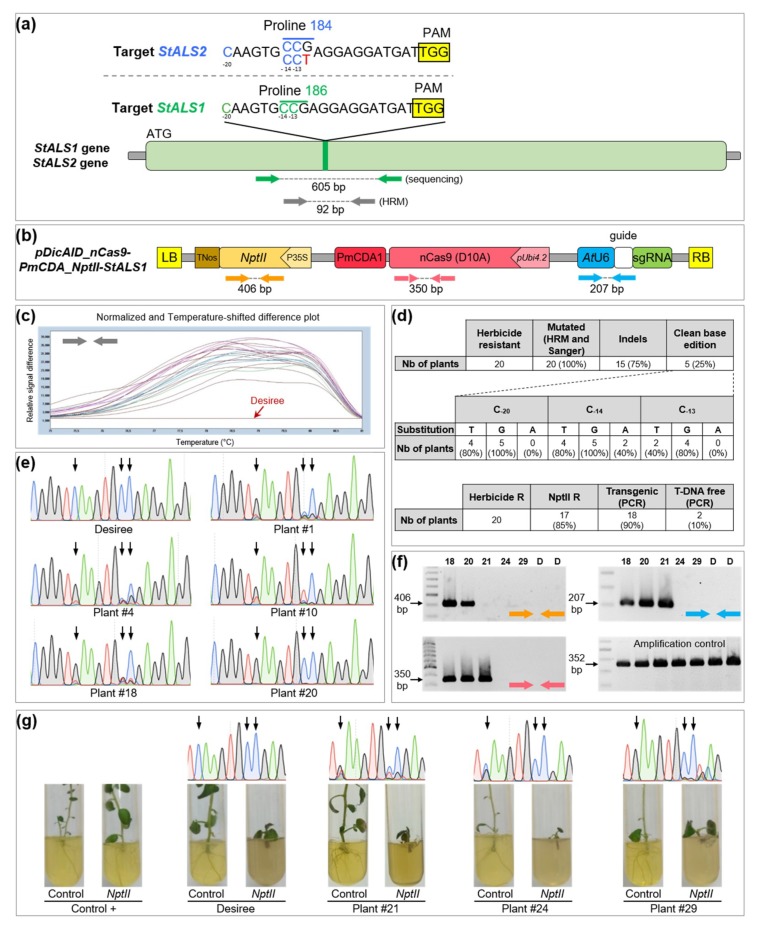
Figure 2.
Targeted modifications in potato StALS gene. (a) target region in the StALS1 and StALS2 genes of the cultivar Desiree. The StALS1 Pro186 codon is highlighted in green and the StALS2 Pro184 codon in blue. The single mismatch in the StALS2 locus is highlighted in red. Targeted C−20, C−14 and C−13 are represented in green and blue for StALS1 and StALS2, respectively. PAM site is highlighted in yellow. Green and grey arrows indicate the relative positions of the PCR primers; (b) T-DNA physical map of the CBE binary vector. Colored arrows indicate the relative positions of the PCR primers; (c) HRM analysis using primers targeting both StALS1 and StALS2 loci. Plants (20) are color-labeled according to their melting curve shape. The wild-type curve is colored in red; (d) summary of mutation efficiency and outcomes for 20 regenerated plants. The number of edited and transgenic or T-DNA-free plants is indicated; (e) Sanger chromatograms of the targeted region (StALS1 and StALS2) of five plants that do not harbor indels. The wild-type sequence is also provided. The black arrows indicate the localization of targeted cytidines; (f) PCR analyses of five chlorsulfuron resistant plants and the wild-type using primers matching the T-DNA (localization is indicated by the colored arrows); (g) Sanger chromatograms and rooting test of the three plants that did not amplify the NptII fragment. The wild-type and a positive control are also included. The black arrows indicate the localization of the targeted cytidines.

