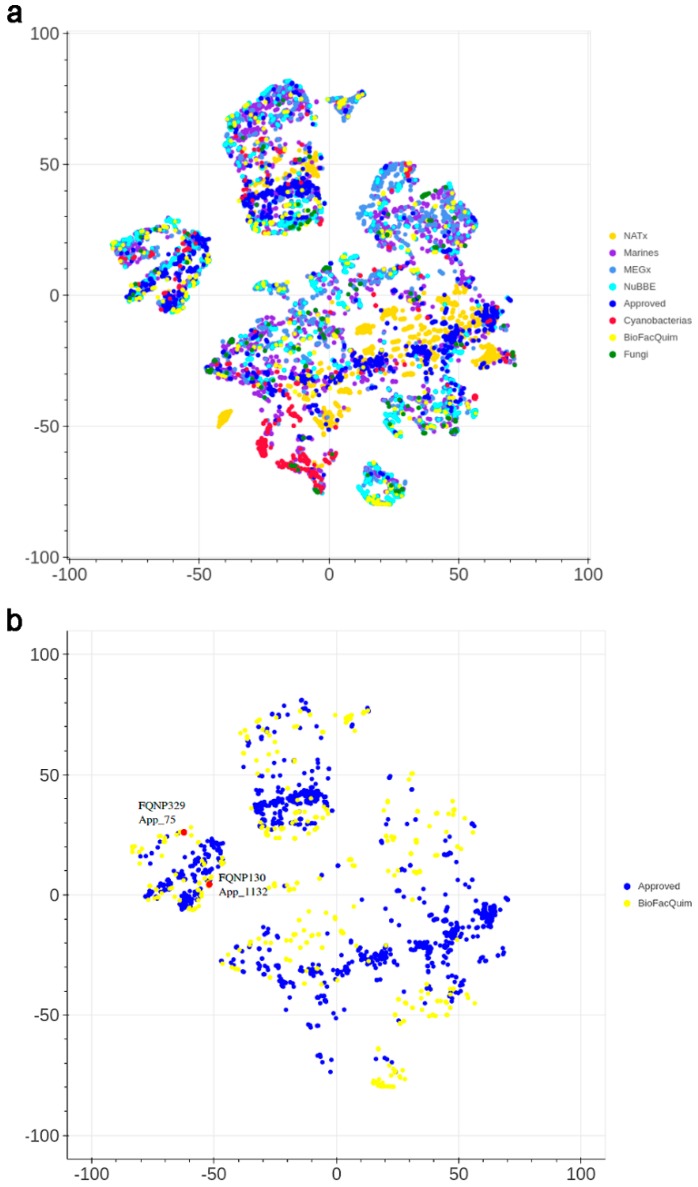
Figure 6.
Visual representation of the chemical space of BIOFACQUIM compared with: (a) all reference data sets; and (b) approved drugs. The visualization was generated using t-distributed stochastic neighbor embedding (t-SNE) based on topological fingerprints. The red dots indicate the position of two representative compounds of BIOFACQUIM that are very similar to approved drugs.

