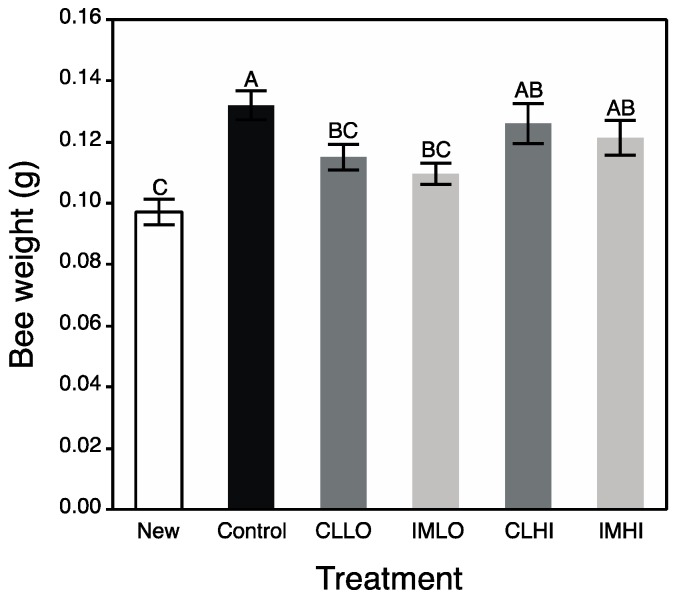
Figure 2.
Mean (±s.e.m) weight of individual newly emerged honey bees and those from pesticide treatment groups after two weeks. White bar = Newly Emerged Treatment; Black bar = Control treatment; Dark grey bars = Clothianidin Low (CLLO) and High (CLHI) dose treatments; Light grey bars = Imidacloprid Low (IMLO) and High (IMHI) dose treatments. Letters above bars represent significant differences across treatments from Student’s post hoc tests.

