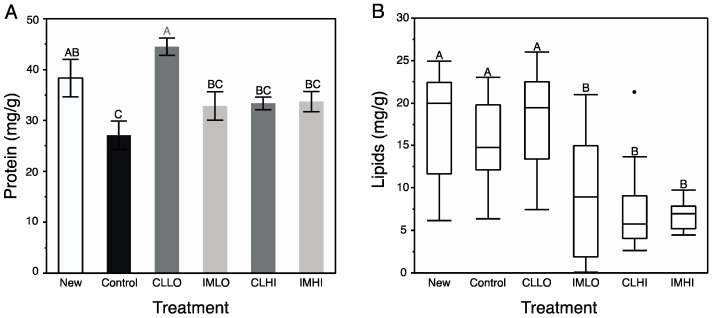
Figure 3.
Mean (±s.e.m) relative quantity (mg/g) of soluble proteins (A) and median (±quartiles) lipids (B), from spectrophotometric assays of homogenized tissues of individual newly emerged honey bees, and those from pesticide treatment groups after two weeks. (A) White bar = Newly emerged bees; Black bar = Control treatment; Dark grey bars = Clothianidin Low (CLLO) and High (CLHI) dose treatments; Light grey bars = Imidacloprid Low (IMLO) and High (IMHI) dose treatments. Single point in (B) represents outlying data point. Letters above bars represent significant differences across treatments from Student’s (A) or multiple comparison Wilcoxon (B) post hoc tests.

