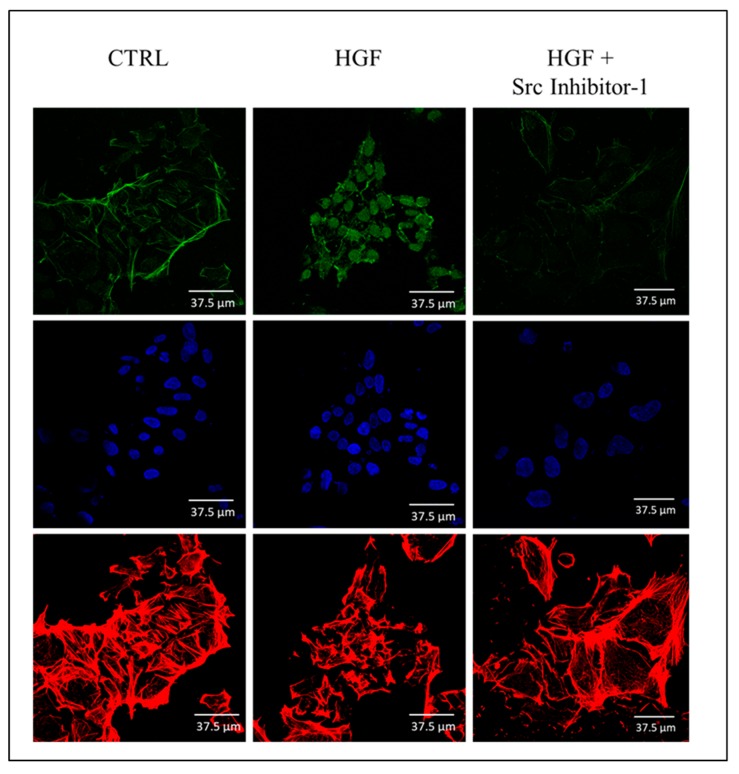
Figure 8.
Confocal microscopy analysis of c-Src phospho Tyr416 distribution-pattern: Immunofluorescence analyses of c-Src phospho Tyr416 (FITC, green signal) in NT2D1 cells cultured with or without HGF and Src Inhibitor-1. Actin cytoskeleton (Rhodamin phalloidin, red signal) and nuclei staining (TOPRO-3, blue signal) are also reported in the figure. The nuclear translocation of c-Src phospho Tyr416 after HGF administration is clearly evident. The treatment with Src Inhibitor-1 prevents this phenomenon.

