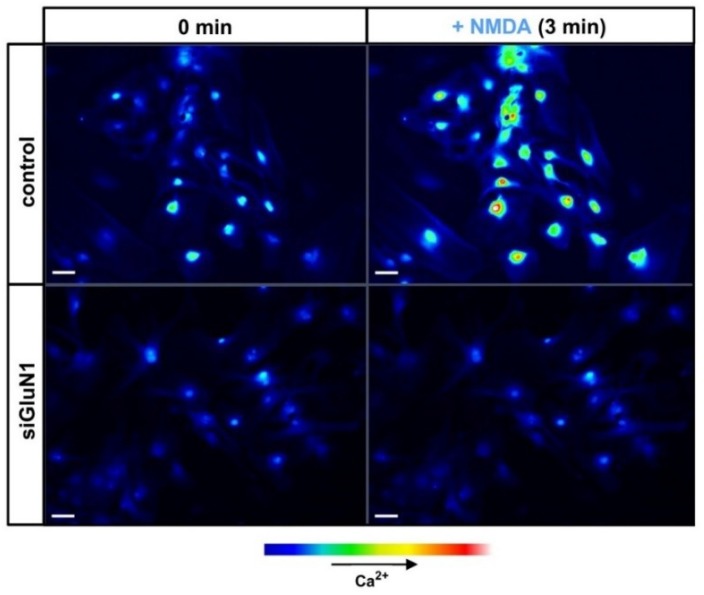
Figure 2.
Confocal images of [Ca2+] changes in cultured mouse astrocytes before (control) and after silencing GluN1 subunit of NMDAR (siGluN1). Silencing procedure was exactly as in Skowrońska et al., (2019) [72]. Cells were pre-loaded with the fluorescent Ca2+ indicator, Fluo-3-AM. The images display untreated cells (0 min, left) and cells treated with 100 μM NMDA (3 min, right). The strength of the [Ca2+] signal is expressed by the relative intensity of Fluo-3-AM fluorescence in a pseudo-color scale (bottom: pseudo-color bar). Scale bars, 50 μm.

