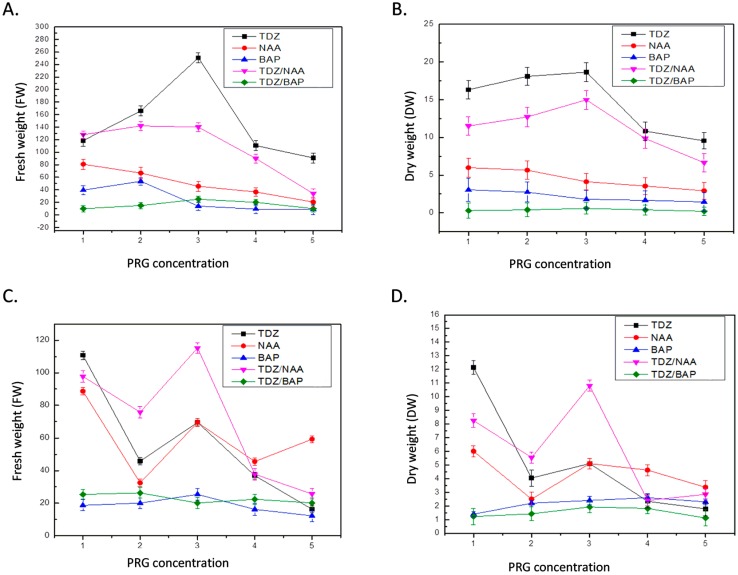
Figure 2.
Time-course fresh and dry weight of callus cultures at different PGRs (in mg/L). (A) Fresh weight for stem-derived callus culture (in g/L); (B) dry weight for stem-derived callus culture (in g/L); (C) fresh weight for leaf-derived callus culture (in g/L); and (D) dry weight for leaf-derived callus (in g/L) cultured on MS medium fortified with TDZ, NAA, BAP (1.0–5.0 mg/L), TDZ (1.0 mg/L) + NAA (1.0–5.0 mg/L), TDZ (1.0 mg/L) + BAP (1.0–5.0 mg/L). Values are means of three replicates with standard deviation.

