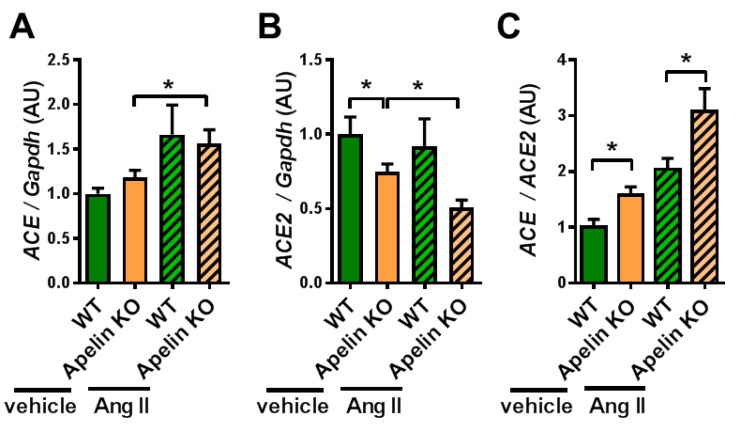
Figure 2.
mRNA expression of ACE and ACE2 in the heart. The heart tissues harvested from Ang II-treated WT and Apelin KO mice were subjected to qRT-PCR analysis to measure mRNA expression levels. mRNA expression of ACE (A), ACE2 (B), and the ratio of ACE expression to ACE2 expression (ACE/ACE2) (C) are shown. n = 4–6 per group. All values are mean ± SEM. * p < 0.05.

