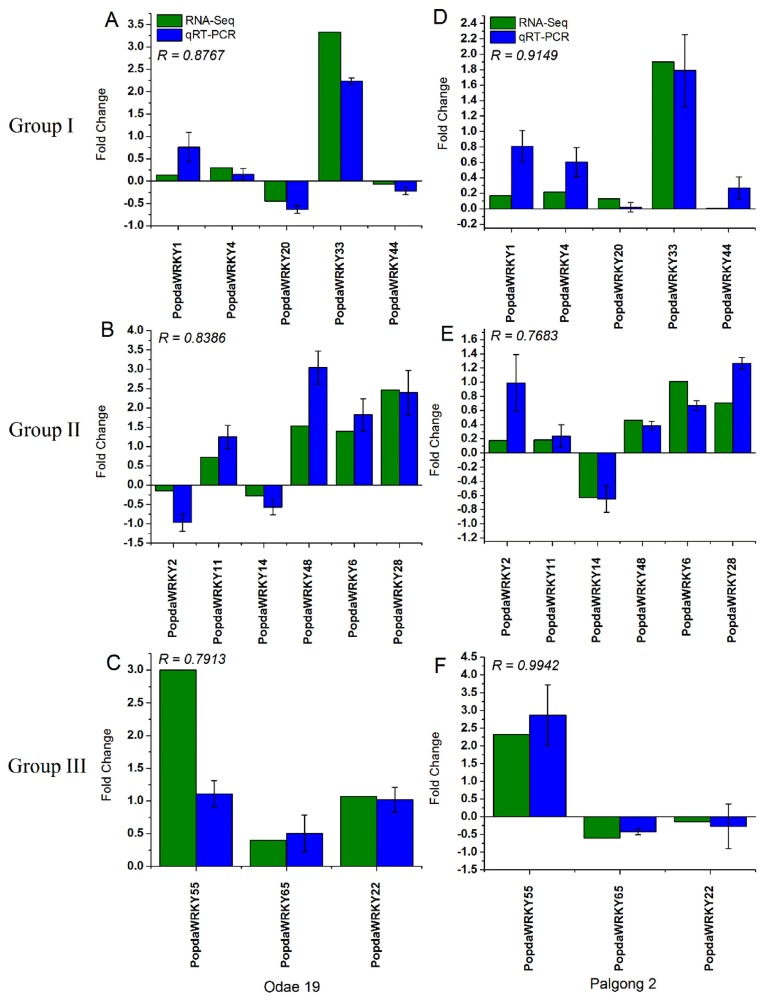
Figure 7.
Validation of RNA-seq results using qRT-PCR in tolerant popular cultivars: The same 14 PopdaWRKYs were also studied in both tolerant cultivars, Odae 19 (A–C) and Palgong 2 (D–F). The fold change calculated from qRT-PCR analysis (white bars) was compared with fold change from RNA-seq analysis (black bars). The R value represents the correlation coefficient, while the error bars represent ± SE from at least three replicates.

