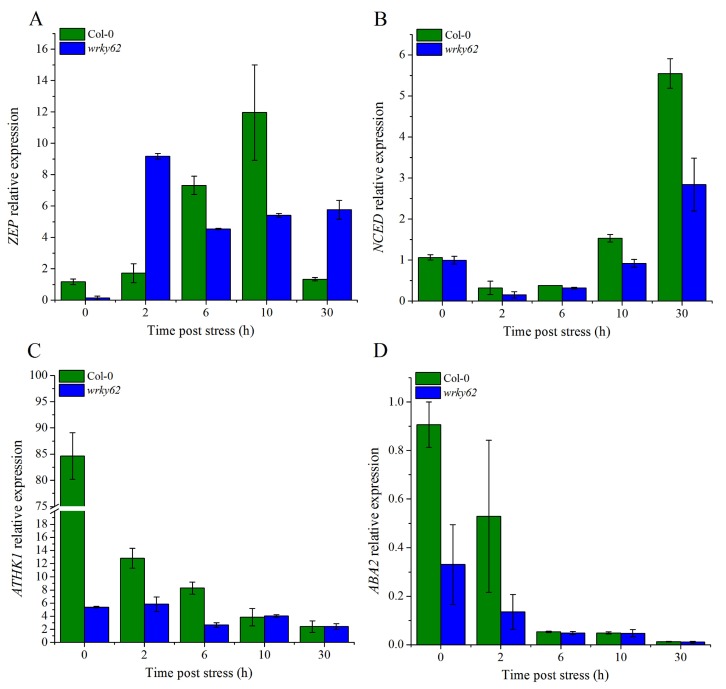
Figure 9.
Relative expression of ABA biosynthesis/signaling genes: Transcript accumulation of (A) ZEP, (B) NCED, (C) AtHK1, and (D) ABA2 after dehydration conditions in the indicated genotypes were analyzed using qRT-PCR. All the data points represents the mean of three replicates. Bars indicates ± standard error.

