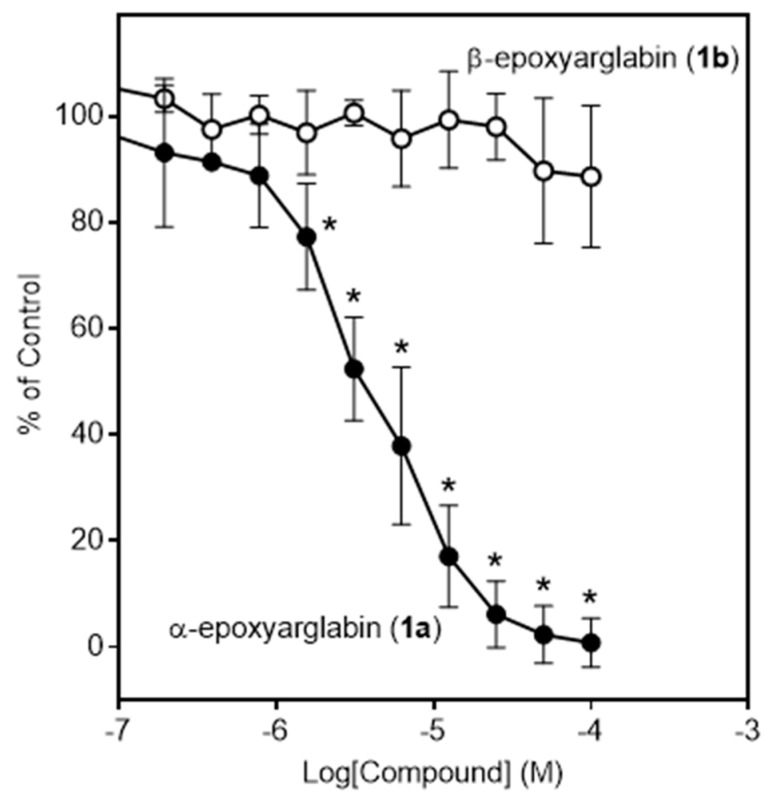
Figure 2.
Effect of α-epoxyarglabin (1a) and β-epoxyarglabin (1b) on activation-induced Ca2+ mobilization in Jurkat T cells. Jurkat T cells were pretreated for 20 min with a control of 1% DMSO or increasing concentrations of the indicated compounds and activated with anti-CD3. Activation-induced Ca2+ flux was measured as described, and the results are shown as the % of maximal activation measured in the control cells. The results shown in both panels are representative of three independent experiments. Statistically significant differences between cells pretreated with compound 1a versus compound 1b are indicated (* p < 0.01).

