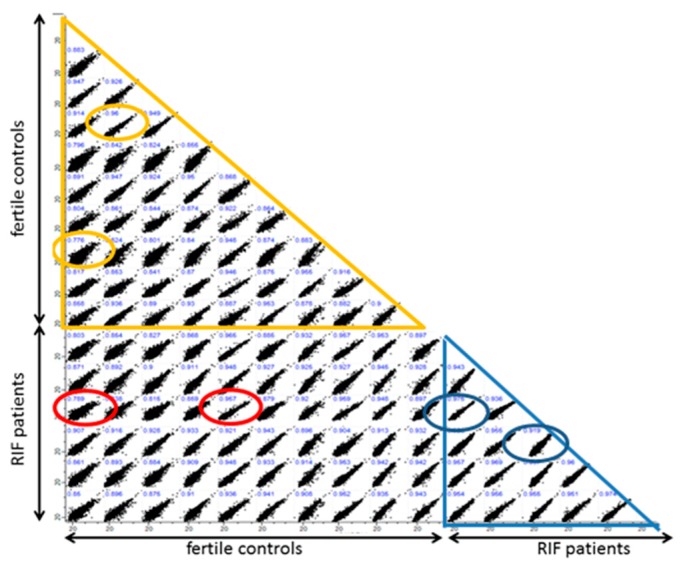
Figure 2.
Intensity correlation (log 2 intensities are shown) of protein of endometrial tissue of RIF patients (n = 6) and PF (n = 10). Comparison within the RIF group is marked by a blue triangle and within the PF group by an orange triangle. Circles represent the highest and lowest correlation coefficient of the respective group comparison. The red circles highlight the highest and lowest correlation coefficient between RIF and PF.

