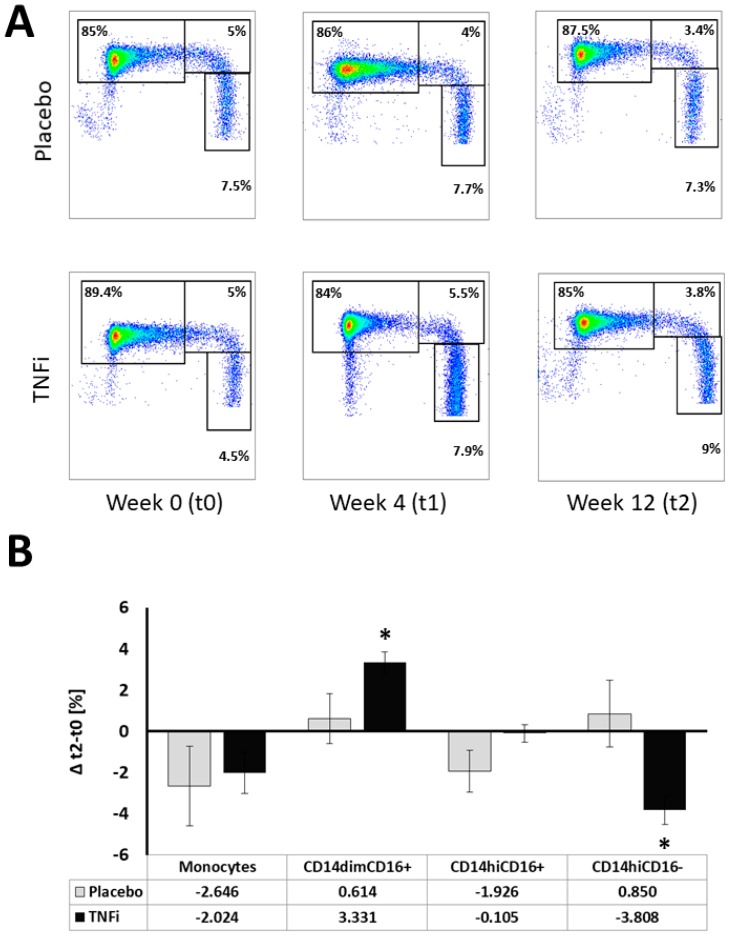
Figure 2.
Monocytes and their subpopulation content in placebo and TNFi groups. (A) Representative flow cytometric dot plots for placebo and TNFi treated groups at week 0 (t0), 4 (t1) and 12 (t2). Panel (B): Mean monocyte content and their subpopulation distribution was calculated as a delta t2−t0. Error bars represent SEM; * p < 0.05.

