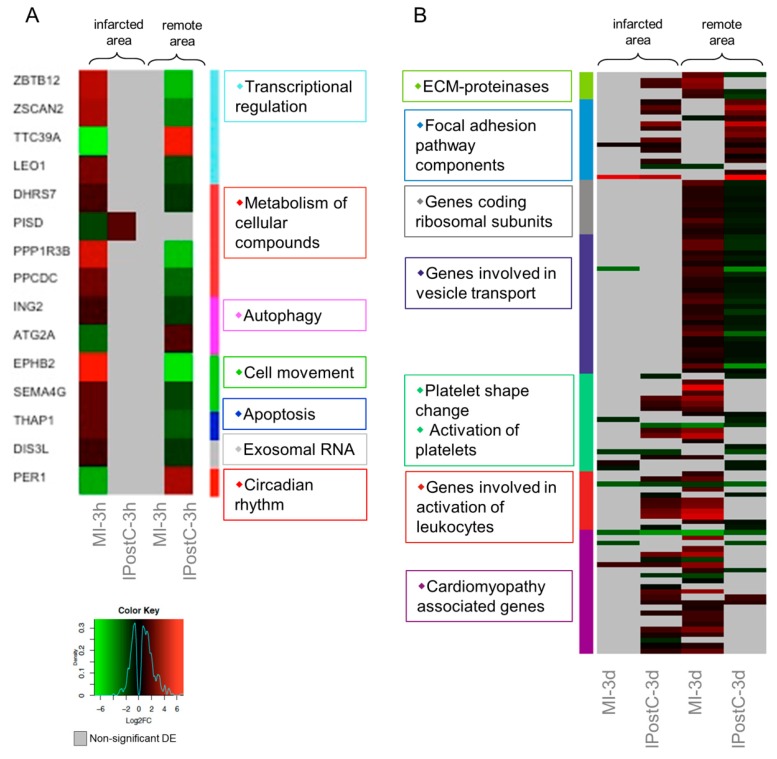
Figure 4.
Heat maps of differentially expressed genes (DEGs) with opposite regulation in the myocardial infarction (MI) (A), and ischaemic postconditioning (IPostC) groups (B). DEGs in the MI-3h (n = 3), MI-3d (n = 3), IPostC-3h (n = 3), and IPostC-3d (n = 3) groups are related to the control group (n = 3). Colors indicate the extent of log2 fold decrease (green) or increase (red) (p-value < 0.05, moderated t-statistics adjusted for multiple testing). Grey indicates non-significant regulation.

