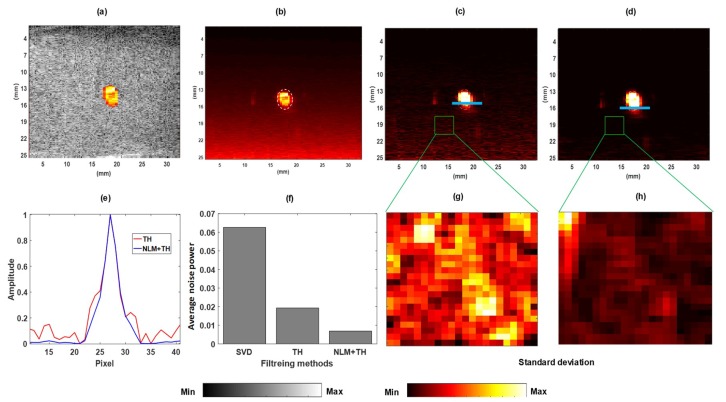
Figure 2.
Flow phantom experiment results: (a) overlaid power Doppler image and B-mode; (b) unbiased singular value decomposition (SVD)-filtered image; (c) filtered image using SVD + top-hat (SVD+TH); (d) filtered image using proposed method non-local mean + TH (NLM+TH); (e) corresponding signal amplitude along blue lines in (c,d); (f) average noise power values for (b–d); and (g,h) are standard deviation maps for identified green color outlined background area in (c,d), respectively.

