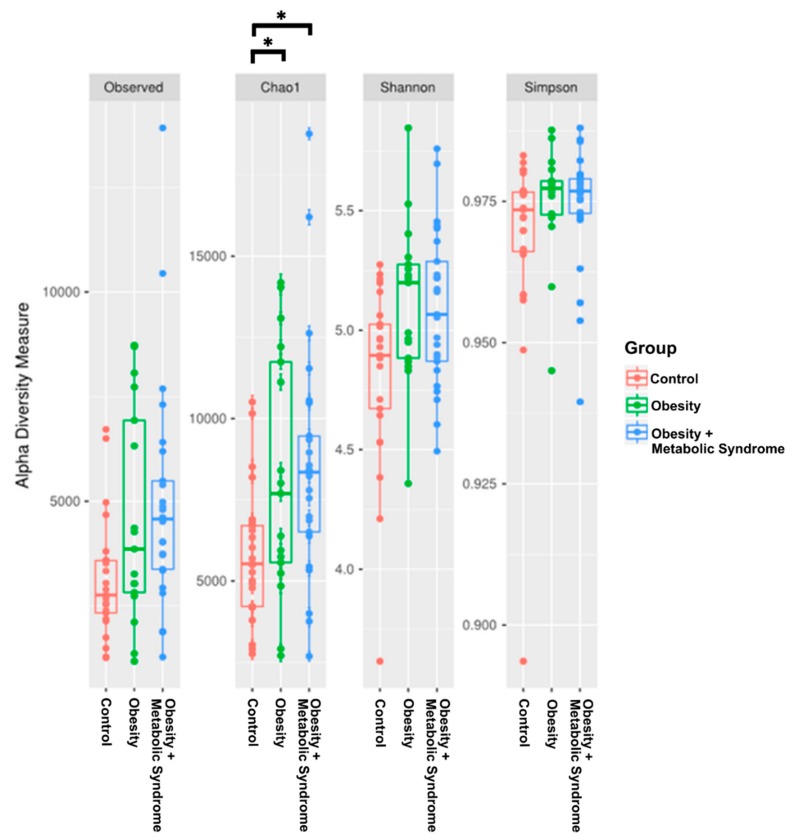
Figure 2.
Bacterial alpha diversity. The box-plot figures show the alpha diversity of the bacterial communities in the three study groups Control, OB, and OMS by means of observed Operational Taxonomic Units (OTUs), and Chao1, Shannon, and Simpson indexes. Plotted in the graphic are the interquartile ranges (IQRs) and boxes, medians (lines in the boxes), and lowest and highest values for the first and third quartiles. Each phenotypic category is identified by colors, as indicated on the right side of the figure. Every sample is represented by a colored dot. Solid lines and asterisks indicate a significant difference between control and obesity (lower), (p < 0.002), and control and obesity + metabolic syndrome (upper) (p < 0.003). P-values were calculated to compares alpha diversities based on a two-sample t-test using a non-parametric methods and the default number of Monte Carlo permutations in order to find different significances among groups (see Table S9).

