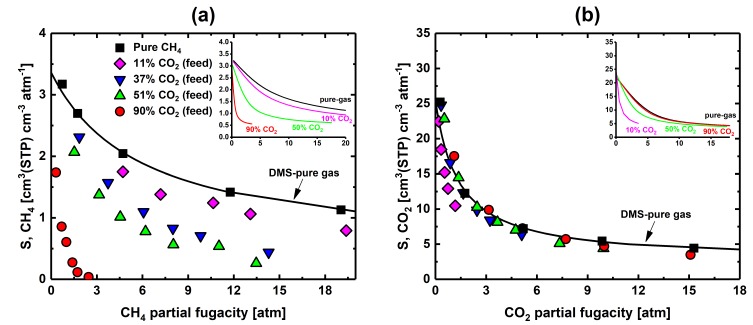
Figure 4.
(a) Experimental CH4 solubility coefficient vs. CH4 fugacity and (b) CO2 solubility coefficient vs. CO2 fugacity of 6FDA-mPDA. The inset graphs report the solubility coefficient behavior of CH4 and CO2 at various equilibrium concentrations—these curves were predicted using the dual-mode sorption model extended to mixtures (DMS-mix) [35] and the pure-gas DMS sorption parameters (Table S1). Note that the feed mixture concentration is the parameter for the experimental data in (a,b), whereas the concentration at equilibrium is the parameter for the DMS-mix predictions (insert graphs); hence, the comparison between experimental data and predictions is qualitative (i.e., the DMS-mix curves guide the reader through the data).

