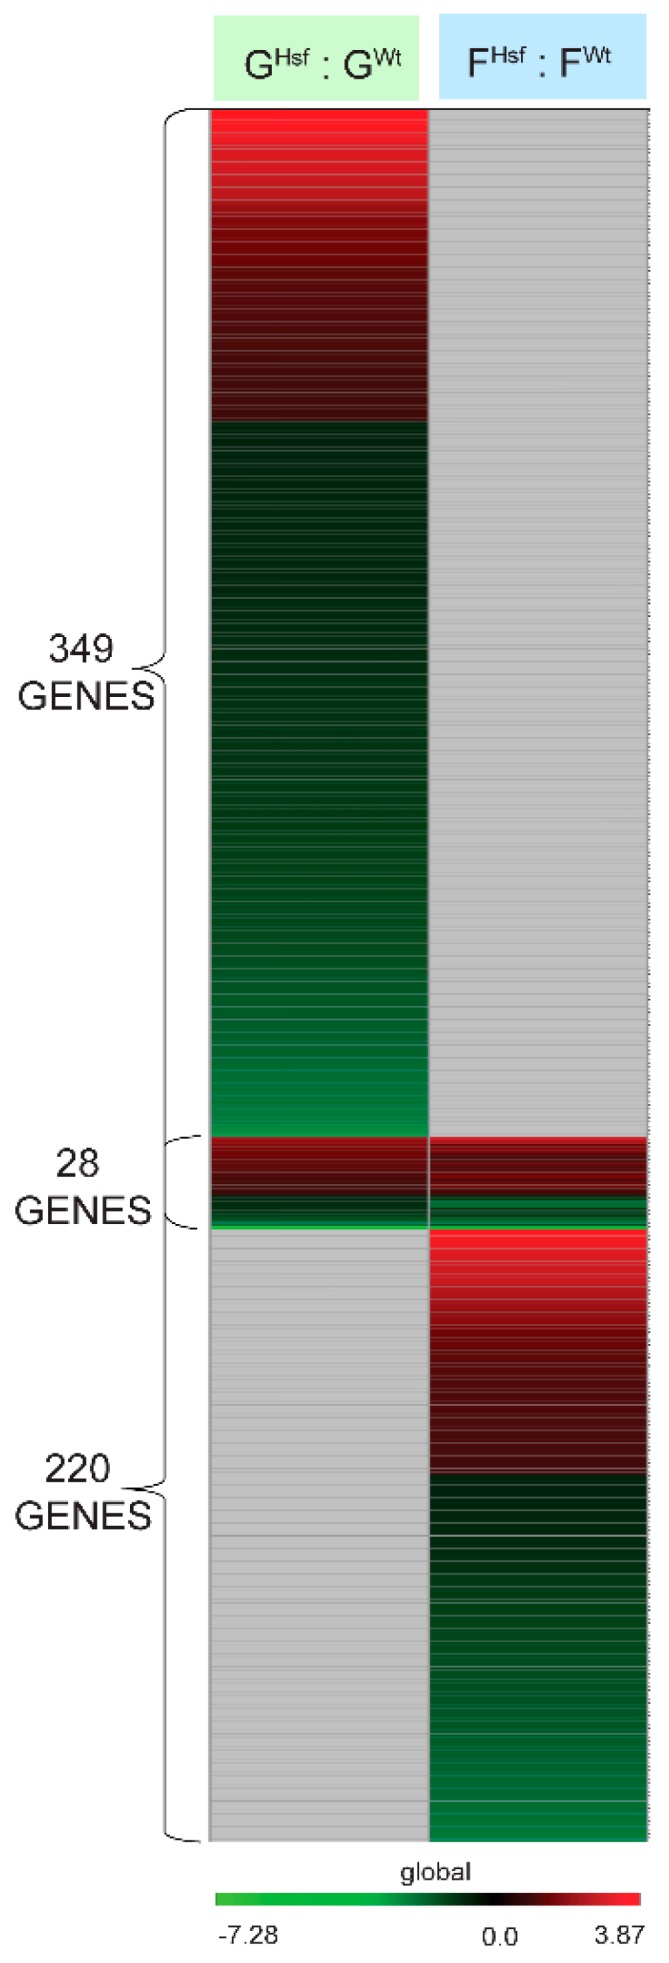
Figure 4.

Heat map visualizing the expression of significantly differentially expressed genes: 349 genes of the ground-adapted state between HSFA2 KO and WT cells obtained from GHsf : GWt group comparison and 220 genes of the spaceflight-adapted state between HSFA2 KO and WT cells obtained from FHsf : FWt group comparison.
