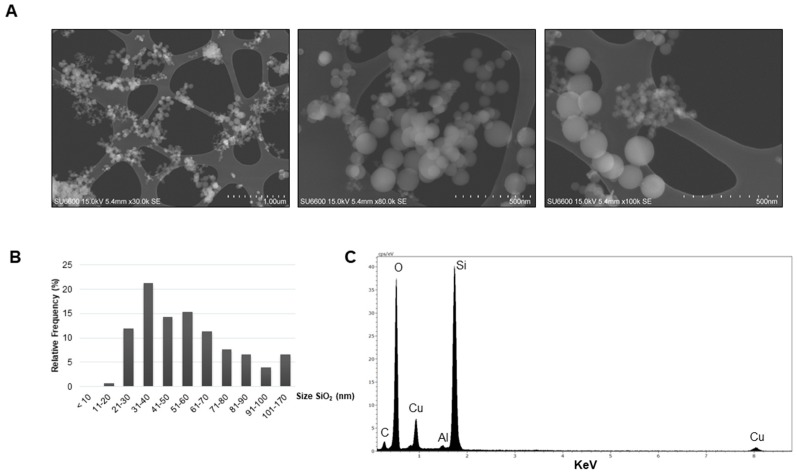
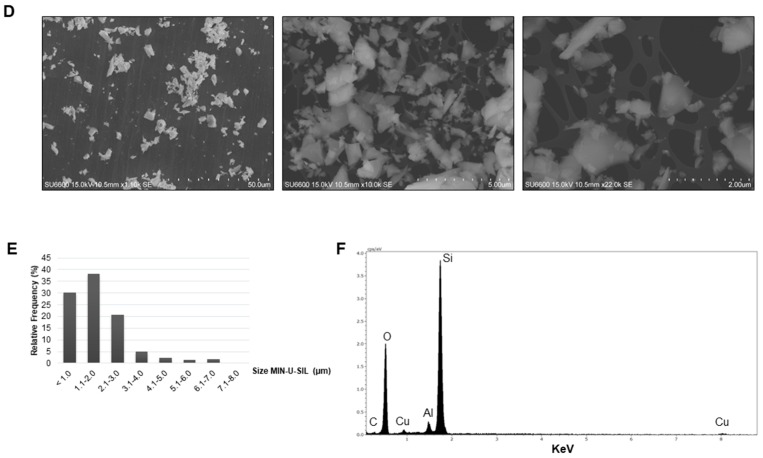
Figure 1.
Characterization of the dry dust by scanning electron microscope (SEM). (A) Representative SEM images of the amorphous SiO2.; (B) The diameter (nm) of the dust particles was measured and the relative frequency in percentage is shown for the different size groups (n = 300); (C) Energy-dispersive X-ray spectrum showing the elemental content of the amorphous SiO2 dust; (D) Representative SEM images of the crystalline SiO2 MIN-U-SIL; (E) The diameter (µm) of the MIN-U-SIL dust particles was measured and the relative frequency in percentage is shown for the different size groups (n = 300); (F) Energy-dispersive X-ray spectrum showing the elemental content of the crystalline SiO2 dust.


