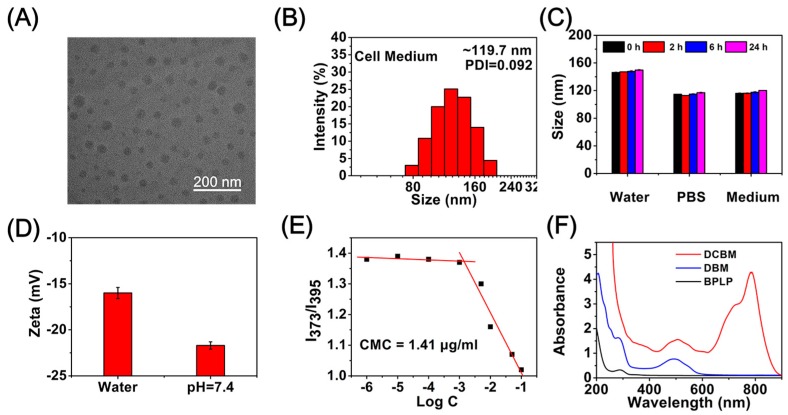
Figure 2.
(A) TEM images of DCBMs; (B) DLS distribution of DCBMs in cell medium; (C) size stability of DCBMs in water, phosphate-buffered saline (PBS), and cell medium at 24 h; (D) zeta potential of DCBMs in pure water and pH = 7.4 aqueous solution; (E) the plot of the ratio of intensities (I373/I395) from pyrene emission spectra as a function of log C; (F) UV spectra of BPLP, DBMs, and DCBMs in PBS.

