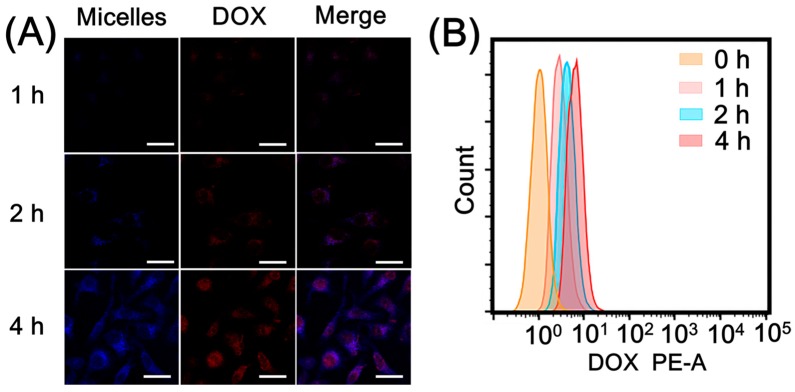
Figure 6.
(A) Confocal laser scanning microscope (CLSM) images of HepG2 cells after incubation with DCBMs for 1 h, 2 h, and 4 h. DOX exhibited red fluorescence, and BPLP segments showed blue fluorescence. The scale bars correspond to 30 μm in all the images. (B) Flow cytometry analysis of cellular uptake.

