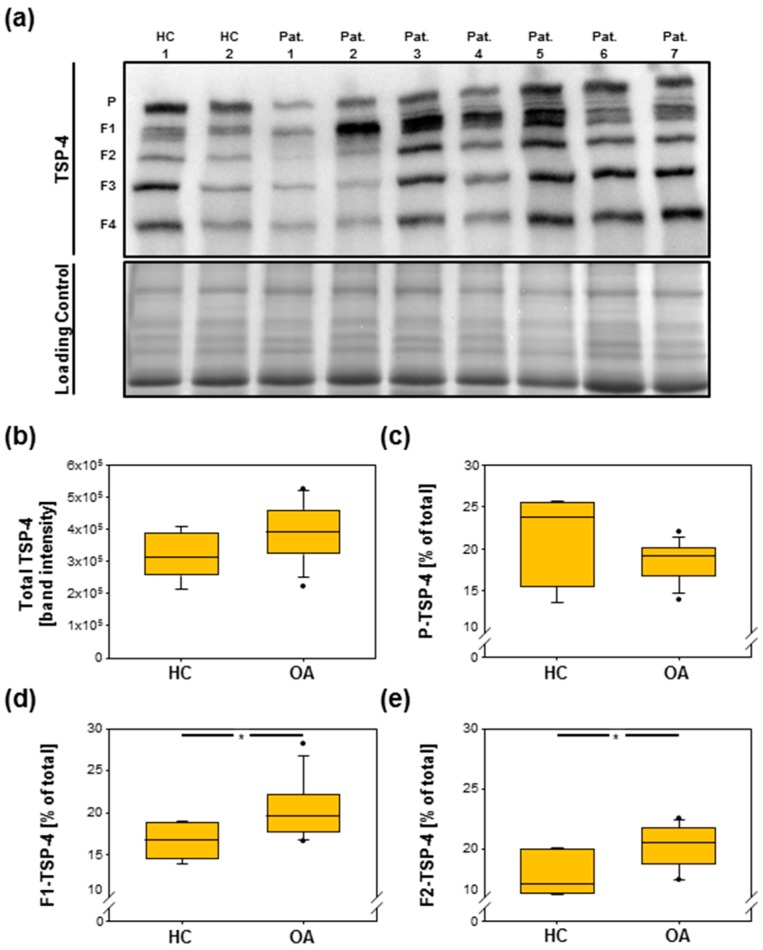
Figure 5.
Detection of TSP-4 in sera of healthy donors and OA patients. (a) The immunoblot analysis of sera shows the pentameric TSP-4 and derived fragments (1–4). Equal loading was demonstrated via PageBlueTM staining (loading control). Amounts of total (b) as well as of pentameric TSP-4 (c) are not significantly different between HCs and OA, but a significant increase of fragment 1 (d) and fragment 2 (e) could be detected in OA patients. Immunoblot was shown as representative blot. Values are represented as box blots and significance (p < 0.05 *) was analyzed by the Mann–Whitney U test. Dots in figures b-e represent outliers. HC = healthy controls; Pat. = patient; OA = osteoarthritis; P = pentamer, F = fragment.

