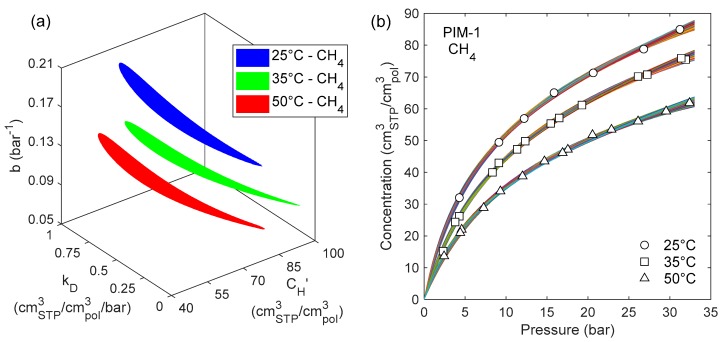
Figure 7.
(a) Surfaces enclosing the range where DMS parameter sets yield SEE < SEEmax in the prediction of CH4 sorption in PIM-1 at three different temperatures; (b) CH4 sorption isotherms in PIM-1 at 25, 35 and 50 °C, calculated with all the parameter sets enclosed by the corresponding colored regions in the plot on the left.

