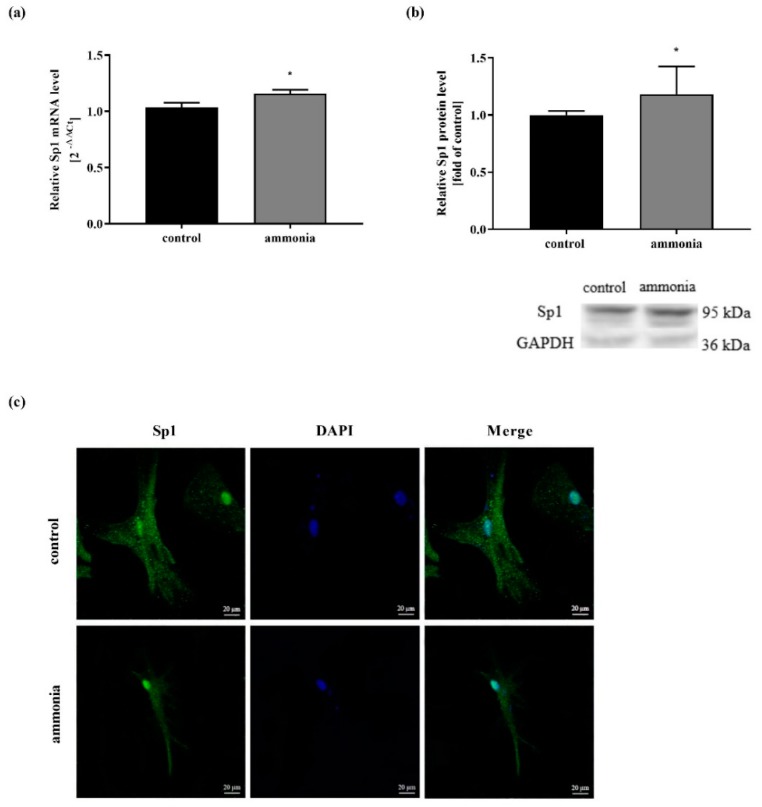
Figure 1.
The effect of ammonia treatment on Sp1 expression and cellular localization. (a) Sp1 mRNA level in mouse cortical astrocytes after 24-h 5 mM ammonia treatment. Results are mean ± SD (n = 4). (*) p < 0.05 vs. control; Student t-test. (b) Sp1 protein level in mouse cortical astrocytes after 24-h 5 mM ammonia treatment. Upper panel shows densitometry analysis, lower panel shows representative immunoblot. Results are mean ± SD (n = 4). (c) Intracellular Sp1 transcription factor localization after 24-h 5 mM ammonia treatment (n = 4).

